

By China Made & Tech Team.
“China’s green-energy dominance” is a useful headline and a poor procurement conclusion.
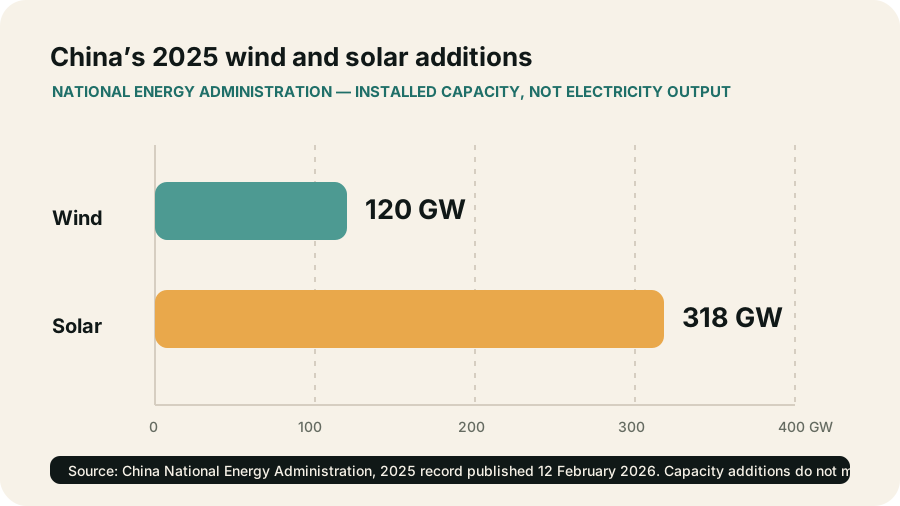
It is useful because the country is materially important at more than one layer of the energy transition. The International Energy Agency (IEA) says China accounts for around 85% of solar and 80% of lithium-ion battery supply-chain production capacity, and around 95% of PV wafer capacity. China’s National Energy Administration (NEA) says the country added 120 GW of wind and 318 GW of solar in 2025. Those are not small signals. They describe a manufacturing system and a domestic buildout whose scale changes the global context for equipment, materials, markets and electricity systems.
They are poor conclusions because neither figure answers the question an actual reader is likely to be asking. A manufacturer’s share of global capacity does not tell a buyer who made a specific module, whether the product is genuine, how it will perform, which factory supplied a wafer, what firmware an inverter runs, whether a battery project fits a grid rule, or whether a supplier can honour a warranty. A national addition figure does not tell a developer how much a particular plant will generate, whether it can connect, how it will be curtailed, what its offtake terms are, or who carries lifecycle responsibility when something fails.
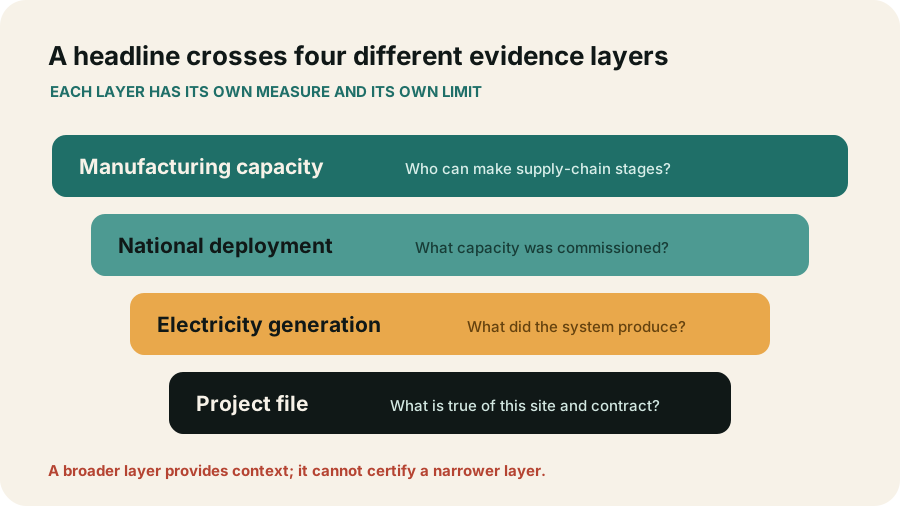
China’s green-energy system therefore needs at least four separate files:
- The manufacturing file: Who can make which components and at what stage of the supply chain?
- The deployment file: What capacity did the country actually commission in a named period?
- The electricity file: What did wind and solar contribute to electricity generation, as distinct from installed capacity?
- The project file: What evidence is needed for a named component, supplier, grid connection, contract and operating life?
The first three explain why China is indispensable context for many green-energy conversations. The fourth prevents that context from becoming a substitute for diligence. The important reader judgment is simple: country-scale manufacturing and deployment show a system’s importance. They do not certify the component, supplier, site, contract or outcome in front of you.
This is a desk-research guide, not an engineering study, component review, factory audit, grid model, supplier assessment, installation report, investment recommendation or legal opinion. It uses IEA analysis, the NEA’s national 2025 record and Ember’s independent electricity analysis. The sources establish different metrics at different dates. They do not identify a particular bill of materials, product origin, site condition, project economics, warranty obligation or local rule.
The four layers inside a green-energy headline
Green-energy language encourages compression. A photovoltaic module appears simple: silicon becomes a wafer, a wafer becomes a cell, cells become a module, the module goes to a project, the project generates electricity. A wind turbine, inverter, battery or electrolyser can be narrated the same way. The story looks like a clean line from factory to renewable power.
In reality, every arrow changes the question. “Capacity” can mean manufacturing capacity, annual production, installed generating capacity, usable storage capacity, electrical output, grid connection capacity or a manufacturer’s financial capacity to support a warranty. “China” can mean a component factory, a China-based parent, an overseas plant, an export route, a domestic project, a state statistic, a policy regime or a supplier ecosystem. “Green” can mean a technology category, an electricity source, an emissions claim, a regulatory label or a commercial narrative. A serious reader must identify which object is being measured before using the number.
| Layer | A sensible question | A record that can help | What it does not decide |
|---|---|---|---|
| Manufacturing | Where is capacity concentrated for wafers, modules, batteries or other stages? | A dated supply-chain analysis with a stated definition | The origin, quality, availability or warranty of one component |
| Deployment | How much wind or solar capacity did a country add? | A national regulator or statistical record | The output, connection or economics of a project |
| Electricity | What share of national generation came from wind and solar? | A dated electricity-mix record | A plant’s generation, curtailment or revenue |
| Commercial conditions | What are sector prices, margins and policy arrangements doing? | A dated market analysis and the actual supplier’s records | The solvency, contract price or lifecycle support of a named supplier |
| Project decision | Is this equipment and project suitable for this site? | Component, supplier, grid, contract and lifecycle evidence | A conclusion inferred from country scale alone |
The practical habit is to put a label on each assertion. Is it about a factory, a supply-chain stage, a national installed-capacity statistic, an electricity-generation share, a project revenue mechanism, a supplier financial condition or a component? Once the label is visible, the next document becomes clearer.
Why the “silicon to solar farm” story is incomplete
The familiar solar chain is real. Polysilicon, ingots, wafers, cells, modules, inverters, racking, cables, transformers, batteries, software, civil works, grid equipment, installation and operations all have roles. But the chain is not a single company or a single country statistic. A module can include multiple material and process histories. It can be assembled in one place using cells from another. An inverter can have a different supplier, software stack and service channel than the module. A battery can have a separate cell, pack, power-conversion, fire-safety and controls file. A project’s value can depend more on grid access, dispatch rules, financing, curtailment, insurance or offtake than on its visible equipment.
That does not make a country-level manufacturing share irrelevant. It makes it contextual. A high share can matter for supply security, diversification strategy, trade exposure, replacement planning and knowledge of where upstream dependencies sit. It does not answer the product or project question by itself.
The same distinction applies to wind. Turbine manufacturing, blades, towers, bearings, power electronics, grid integration, installation vessels or cranes, service capacity and site wind resource do not become a single “wind dominance” metric. It applies to storage as well. Cell production, pack assembly, thermal management, power-conversion systems, energy-management software, controls, fire response, installation, interconnection and long-term service need their own evidence. The site’s published guide to China Battery Storage Boom: Grid-Scale BESS Explained adds storage context; it does not validate a particular BESS design, supplier or grid study.
The manufacturing file: concentration is not a component verdict
The IEA’s 2026 supply-chain analysis is a useful starting point because it describes concentration by supply-chain stage rather than repeating a vague national label. The agency says China accounts for around 85% of solar and 80% of lithium-ion battery supply-chain production capacity. It puts China’s share of PV wafer capacity at around 95%.
Those figures make an important point: concentration is not evenly distributed. A wafer is not a module. A battery cell is not an entire storage system. A downstream assembly line is not every upstream input. A number that correctly describes one stage can be misused if it is carried across the whole system. This is why a reader should ask not only “how much of the supply chain is in China?” but “which stage, what measure, what period, and capacity or actual production?”
Capacity is an option to produce, not a record of every sale
Manufacturing capacity describes what plants could produce under the definition and period used by the source. It is not automatically equal to output, shipments, revenue, utilisation, inventory, export volume or profit. A factory may run below nameplate capacity. New capacity can come online before demand catches up. A company can have a supply-chain position without being the seller on a project. A product sold in one market can be made through a different legal or geographic arrangement than the reader expects.
This distinction matters in solar because several stages are visible in a simplified diagram yet economically different. Upstream materials and wafers have different capital, energy, process and sourcing characteristics from cells and modules. Modules may be easy to see and compare in a catalogue, but they are only one part of a project. An installation also needs electrical design, inverters, structures, cables, protection, transformers, monitoring, access, construction quality, interconnection and service. A manufacturing share cannot fill those files.
The IEA uses an “N-1” perspective to consider what happens if the largest exporter is unavailable in selected supply chains. That is a resilience frame: it asks whether supply outside the largest source could cover demand under a disruption assumption. It is not a country-quality league table. It does not say a component from China will fail, or that a component from elsewhere will be better. It directs the reader toward a different question: what happens to the particular project if a named supply route, vendor, component, spare part or software-service channel is disrupted?
What manufacturing concentration can usefully change
The appropriate response to concentrated capacity is not a universal recommendation to buy or avoid a product. It is a stronger evidence request.
- For a module, ask which legal entity is selling, which model and bill of materials apply, what serialisation and traceability information exists, what origin documentation is relevant, which testing and certification documents apply, and who owns the warranty obligation.
- For an inverter, ask which hardware revision and firmware are supplied, which entity provides local support, how updates are governed, what data and remote-control arrangements exist, which grid codes are supported, and what happens if a service channel changes.
- For a battery system, ask for the cell and pack identity, power-conversion configuration, thermal and fire-safety design, controls architecture, test and acceptance documentation, emergency response obligations, warranty terms and degradation assumptions.
- For a wind project, ask for the exact turbine, service arrangement, spare-parts path, commissioning evidence, grid-study requirements, site resource data, access constraints and long-term maintenance responsibilities.
These files do not deny the value of the IEA’s country-level analysis. They follow from it. If a large part of a supply chain is concentrated, component and continuity questions become more—not less—important. The reader’s task is to identify the exposed stage and the fallback, not to assume a global share determines an individual product’s technical or commercial answer.
Scale does not erase origin and trade documentation
An equipment buyer sometimes starts with a country story because it is easy to find. An actual import, however, turns on the item and transaction: the product classification, manufacturer and seller identities, origin analysis, route, destination rules, documents, tariff or trade measures if relevant, shipping terms and party responsible for each step. Manufacturing concentration does not tell a reader which documents will be accepted for a particular shipment.
For US import context, US & EU Tariffs on Chinese Solar Panels 2026 explains a separate duty and cost file. It is not a shortcut to deciding origin for a specific module, nor is it a recommendation to import. A project team should treat jurisdiction-specific import records as their own workstream. They belong beside—not inside—a broad description of China’s manufacturing system.
The deployment file: capacity needs its national label
China’s domestic buildout is the second reason the country matters. It is a large home market for equipment, construction, grid integration, policy design and learning-by-doing. It is also a source of numbers that are frequently repeated without their measurement boundary.
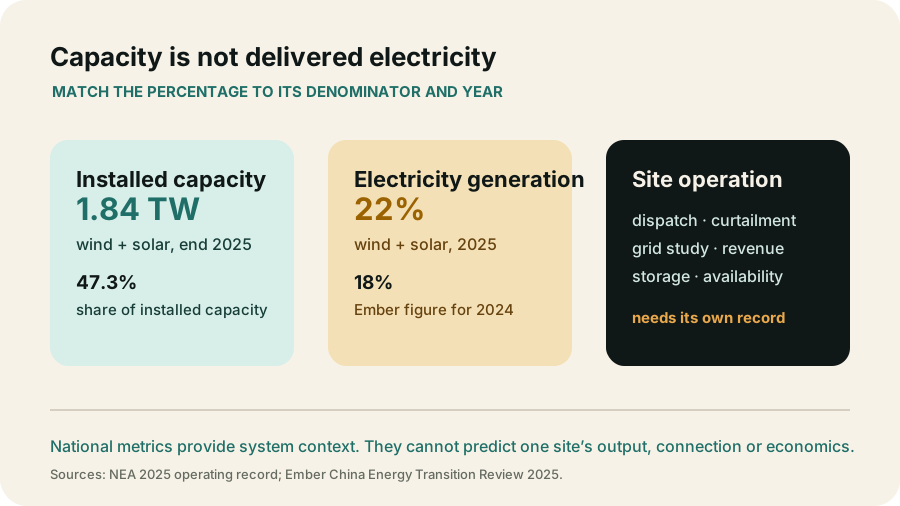
The NEA’s full-year 2025 record, published on 12 February 2026, says China added 120 GW of wind and 318 GW of solar capacity during 2025. It says cumulative grid-connected wind and solar capacity reached 1.84 TW, representing 47.3% of national installed power capacity.
These figures deserve the reader’s attention. They describe national additions at a scale that affects global demand, equipment markets, construction capacity, grid planning and the strategic relevance of Chinese suppliers. They also make the headline “China is adding renewables quickly” concrete. The 318 GW number is not a vague sign of enthusiasm; it is a national solar-capacity addition figure for a stated calendar year. The 120 GW number is the corresponding wind addition figure. The 1.84 TW figure is a cumulative grid-connected wind-and-solar capacity measure at the end of the period.
Installed capacity has a specific meaning
Installed capacity is the rated power capability of equipment connected to a system under the metric’s definition. It is not electricity generation over a year. It is not the amount of electricity delivered at every hour. It is not a record of how much curtailment occurred. It does not establish the availability of a site, the condition of a component, the economics of a project, the effectiveness of storage, the strength of a local network or the impact on a specific thermal plant.
The distinction is familiar to power-system professionals, but it is still lost in public conversation. A gigawatt of new solar capacity and a gigawatt of new wind capacity do not produce the same annual electricity, do not have the same daily shape, do not require the same land or connection design, and do not have the same relationship to demand. The answer changes by site, resource, technology, orientation, availability, grid conditions, dispatch, storage, curtailment and time. A national total cannot compress those differences into one outcome.
This does not weaken the NEA record. It shows why the record is useful. The number tells a reader about scale at the deployment layer. It tells a developer, buyer or analyst where to ask the next question: how is that capacity being integrated, and what evidence exists for the particular system being assessed? The correct response is not “capacity means nothing.” It is “capacity has a denominator.”
National deployment and global manufacturing are connected, but not identical
Domestic deployment can support supplier ecosystems through demand, installation experience, standards development, grid integration work and commercial learning. Manufacturing capacity can support domestic buildout through equipment availability, scale and industrial specialization. The two systems can reinforce one another. But public records that describe one are not proof of the other.
A country can have high manufacturing capacity and export a large part of output. It can add enormous domestic capacity while using multiple vendors and component routes. A company can sell abroad while having little participation in domestic projects. A project can use Chinese-made equipment while being governed by a developer, lender, grid operator, EPC contractor and regulatory regime outside China. Any sentence that uses “therefore” between these layers needs the missing evidence.
For readers comparing module suppliers, Chinese Solar Brands: LONGi vs Jinko vs Trina (2026) is a separate, published brand context. Brand comparisons are still not a project acceptance certificate. A team needs the exact model, testing, documents, contract, delivery, installation and warranty terms that apply to its site. The national buildout provides a reason to understand the ecosystem; it does not remove the need to verify the product being delivered.
The electricity file: capacity is not delivered output
The next layer is electricity generation. A capacity total tells the reader what has been installed; a generation measure tells the reader something about electricity produced over a period. They answer related questions with different denominators.
The NEA says China’s wind and solar generation rose 25% in 2025 and accounted for 22% of national electricity generation. That is a national output-share record, not a capacity-share record. It is useful because it shows that the installed buildout is associated with a growing contribution to the country’s electricity mix. It is not a claim that every unit of installed wind or solar capacity generated at the same rate, that each project was fully dispatched, or that a site in another country would see similar output.
Ember’s China Energy Transition Review 2025 gives a separate independent context: it says China generated 18% of its electricity from solar and wind in 2024. The year and denominator matter. Ember’s figure is a 2024 national electricity share. The NEA’s 2025 figure is a later national record. Neither should be placed beside the 47.3% installed-capacity share as though all three were the same measurement.
| Metric | Source and period | What it measures | What it cannot show alone |
|---|---|---|---|
| 1.84 TW | NEA, end 2025 | Cumulative grid-connected wind and solar installed capacity | Annual electricity output, curtailment or project revenue |
| 47.3% | NEA, end 2025 | Wind and solar share of national installed power capacity | Share of national generation or a site’s capacity factor |
| 22% | NEA, 2025 | Wind and solar share of national electricity generation | A project’s dispatch, storage requirement or return |
| 18% | Ember, 2024 | Wind and solar share of China’s electricity generation | A direct comparison to a later capacity statistic |
Generation is still not a grid-integration report
A generation share is more informative than a capacity number for a question about electricity output, but it remains a national aggregate. It does not show whether a given project can interconnect on schedule, whether the local network requires upgrades, whether a location faces constraint or curtailment, how storage is dispatched, whether reactive power or grid-forming functionality is needed, or what the power purchaser will pay for different hours of generation.
Those details are project files. They may involve a grid impact study, interconnection agreement, resource assessment, design basis, EPC scope, model validation, protection coordination, controls architecture, operating constraints, energy-management strategy, metering arrangement, offtake terms and insurance requirements. The exact list changes by technology, country and grid. The principle does not: a national generation share does not replace a site study.
This is particularly important when the conversation moves from generation to storage. A rising wind-and-solar share can make flexibility a more salient question. It does not define the battery duration, control mode, fire-safety arrangement, business model or acceptance tests that a project needs. A team evaluating grid-forming capability needs model-specific, site-specific and grid-operator-specific evidence. A national transition headline is a reason to ask, not an answer to accept.
Electricity data can be a map for better questions
The value of the NEA and Ember figures lies in the question they prompt: how does a large system manage an increasing share of variable resources? That question can lead a reader to transmission, distribution, storage, market design, demand response, hydro, thermal flexibility, power electronics, controls and planning. Each is more useful than a generic conclusion that “renewables are winning” or “the grid cannot cope.”
Neither slogan is a record. Both can hide real engineering and commercial questions. A project team needs the requirements set by its local grid operator. An equipment buyer needs the model’s certified capability, configuration, software governance and support arrangements. An investor or lender needs a financial model with actual assumptions. A policy reader needs the relevant rule, implementation date and data. China’s national data may inform the backdrop; it does not set the answer for each of these tasks.
The commercial file: low prices do not complete diligence
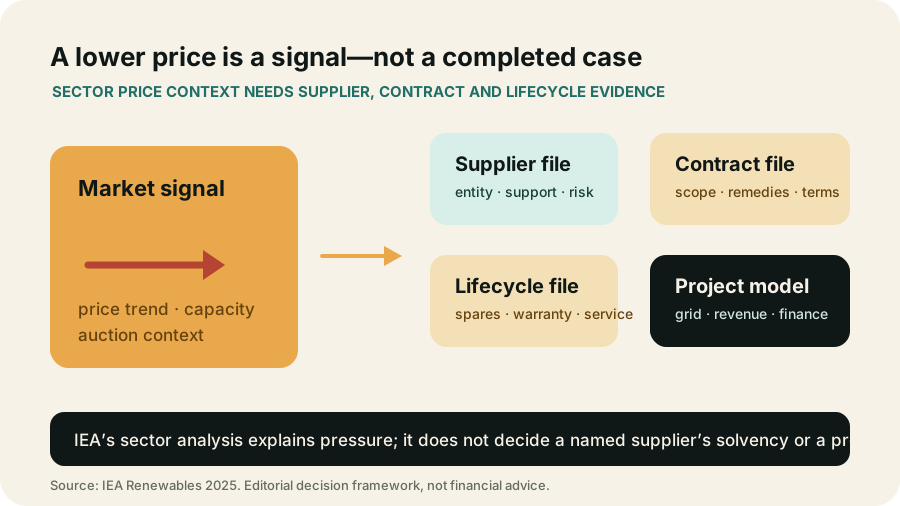
The most tempting shortcut in Chinese green-energy discussions is price. A reader sees cheap modules, broad supply or high manufacturing capacity and assumes the commercial decision is settled. The relationship between scale and price is real, but a low price is not a complete measure of value, supplier resilience, contract protection, lifetime cost or project return.
The IEA’s Renewables 2025 analysis describes the tension. It says China’s solar PV prices were down over 60% since 2023. It also says the largest manufacturers’ net margins reached negative 10%, with cumulative losses near USD 5 billion since the beginning of 2024. The same analysis says that after June 2025 China shifted from fixed tariff arrangements benchmarked to provincial coal prices toward competitive auctions and regional wholesale-market participation, changing projected investor profitability and leading the IEA to revise its forecast slightly.
These facts belong together. Low equipment prices can help make solar deployment more affordable. They can also coexist with price competition and financial pressure among manufacturers. A domestic policy change can improve market integration while changing the way developers expect to earn revenue. None of that tells a reader whether a specific supplier will be solvent through a warranty period, whether a particular project will meet its financial model, or whether a quoted component price includes the service and contract terms that determine real cost.
Price is a signal; total exposure is a file
A price quote answers a narrow question: what someone proposes to charge under stated terms, on a stated date, for a stated configuration. It does not necessarily include freight, duties, insurance, installation, commissioning, spares, software, support, degradation, financing, delay risk, replacement cost or the value of a warranty if the issuer cannot perform. It also does not tell the reader whether the component is the exact model documented in technical and certification materials.
The reader should therefore ask what the price is attached to. Is it a module only, an inverter only, a battery rack, a complete system, a delivered package, an EPC scope or a long-term service offer? What volumes, dates, currency, Incoterms or equivalent trade terms, payment schedule, acceptance conditions and change-control provisions apply? Who carries product liability, performance obligations and the cost of repair? What entity provides the warranty, and what evidence exists of the entity’s capability to support it? A national PV-price trend cannot answer these questions.
Financial pressure is not a universal supplier verdict
The IEA’s margin and cumulative-loss figures are sector context. They show why it is unsafe to infer that scale alone produces durable commercial health. They do not prove that every Chinese manufacturer is distressed, that a particular manufacturer will fail, that a non-Chinese supplier is safer, or that a project should be cancelled. Those conclusions require entity-specific financial, contractual and technical evidence.
For a buyer, current commercial pressure is a reason to improve—not abandon—the supplier file. Ask which legal entity is offering the product and warranty. Request current financial and corporate information appropriate to the value and duration of the contract. Understand the terms for substitutions, change of control, insolvency, spare parts, service, escrow where appropriate, technical support and remedies. Make sure that product acceptance and long-term performance obligations are assigned to parties that can actually be identified.
The same applies to a developer choosing an EPC contractor or integrator. A component price may be attractive while the interface between suppliers is under-specified. A module manufacturer may not be responsible for an inverter issue; a battery cell maker may not be responsible for power-conversion controls; an EPC may not carry a long-term software or service obligation. The commercial file must map the responsible party at each interface.
Auctions show why deployment and project economics are separate
The IEA’s discussion of China’s move to competitive auctions offers a broader lesson. A national deployment system can change the way projects are remunerated. That can alter aggregate investment forecasts and developer behaviour. It does not tell a reader the exact revenue terms, curtailment exposure, connection date or debt conditions for an individual project.
This is one reason a country-level green-energy story should not be turned into an investment thesis without another layer of work. Project economics depend on local resources, grid access, off-take or merchant exposure, construction cost, financing, regulatory treatment, schedule, taxes, insurance, operations and assumptions about future prices. Equipment may be an important input, but it is not the whole model. A good project file identifies the point at which a country-level signal stops and a site-level assumption begins.
The control and lifecycle interfaces belong in the project file
Modern green-energy hardware is not only a set of physical components. It is also a control system. Inverters, battery energy-management systems, plant controllers, meters, weather inputs, communication links and remote-service tools can shape how a project responds to the grid and how its operator sees a fault. A module’s datasheet cannot describe those interfaces. Neither can a national PV-capacity statistic.
That means a project team should ask a separate control-layer question: which device can change which operating setting, through which network path, under whose authorization, and with what record of the change? The answer may sit across several parties: the hardware manufacturer, system integrator, EPC, owner, asset manager, grid operator and software provider. A system can look complete at commissioning while the responsibilities for patches, configuration, alarm handling, data retention, cyber incident response and replacement hardware remain unclear.
The lifecycle question has the same shape. A warranty is not merely a term in a brochure. It must attach to an entity, a duration, defined conditions, a remedy path, exclusions, a process for testing or claiming a defect, and a practical route for repair or replacement. Long-lived assets also need a plan for spares, service access, monitoring, model revisions, end-of-life treatment and changes in ownership or support arrangements. The details vary with the technology and contract. What does not vary is the need to identify who carries each obligation.
This is why a system-level story can be strategically interesting yet insufficient for an operating asset. Manufacturing scale helps frame supply exposure. National deployment helps frame experience and market size. The control and lifecycle file determines whether the site remains governable after the headline has passed.
The project file: a country headline cannot commission a plant
China’s manufacturing system, domestic deployment and evolving market conditions make it essential context for a clean-energy project. They cannot commission the project. That requires the records of the actual physical and commercial object.
The most useful final step is to translate a broad headline into the file that would answer the reader’s decision. This is not a universal checklist or a substitute for qualified engineering, legal, financial or safety advice. It is a way to avoid asking national statistics to do a job they cannot do.
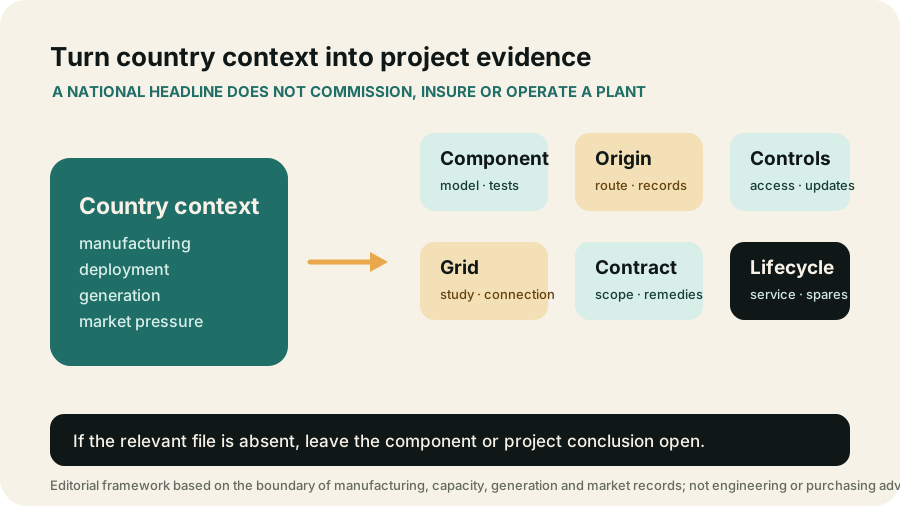
| If the decision concerns… | The file should identify or verify… | A China-level statistic cannot replace… |
|---|---|---|
| A module or turbine component | Exact model, revision, technical documentation, manufacturer/seller, test and certification records, serialisation and warranty party | The product-specific documentation and responsible entity |
| Origin or supply continuity | Bill of materials or origin evidence where appropriate, supplier route, inventory, shipping, substitutes and contractual remedies | The actual origin, route and availability of an order |
| An inverter or control system | Hardware/firmware version, configuration, data flows, remote access, updates, grid-code capability, support and incident process | A controls and cybersecurity assessment for the site |
| A BESS | Cell/pack/PCS identity, thermal and fire-safety design, EMS configuration, test and acceptance evidence, warranty and response obligations | A system design, grid study and emergency plan |
| Grid connection and output | Resource assessment, interconnection record, grid study, dispatch/curtailment assumptions, meter and offtake terms | The energy yield, connection date or revenue of a site |
| Long-term commercial support | Contract scope, payment and acceptance terms, change control, service, spares, warranty, remedies and responsible legal entities | A conclusion inferred from a broad price or capacity trend |
Separate the supply chain from the accountability chain
The supply chain asks who made, moved and integrated physical things. The accountability chain asks who is responsible when a product, connection, performance assumption, software update, warranty or service obligation is disputed. The two overlap, but they are not identical.
A manufacturer may produce a component while a distributor sells it. An EPC contractor may install it. A project company may own it. A grid operator may specify controls requirements. A software provider may support an energy-management system. A lender or insurer may impose documentation requirements. The party on a brand’s brochure may not be the party responsible under the contract. The country in which a component was made may not be the jurisdiction governing the sale or project.
This is where broad clean-energy narratives are most likely to fail a real decision. A team says “Chinese solar is cheap” when it needs a comparison of delivered and installed cost with support and risk terms. It says “China leads batteries” when it needs a defined BESS architecture and acceptance protocol. It says “China added record wind and solar” when it needs a local grid study. The phrase is not wrong; it is incomplete at the moment it matters.
What a careful reader should retain
China’s clean-energy importance is not a myth created by headlines. IEA supply-chain analysis, NEA deployment data and national electricity records document material scale. The important correction is not to deny that scale. It is to make the scale legible.
Manufacturing capacity can explain why upstream availability, diversification and trade exposure matter. Domestic additions can explain why China is a major arena for building and integrating renewable capacity. Generation shares can explain why the power-system story is about more than factories. Price, margin and auction analysis can explain why lower equipment prices do not finish the supplier or project case.
The project file then asks the questions that a country statistic leaves unanswered: What exactly is being supplied? By whom? From where? Under which technical configuration? Connected to which grid? Governed by which controls and contracts? Supported for how long? Those questions are not a rejection of China’s green-energy system. They are how a reader turns a global system into a credible decision.
What to watch next
This guide should be reviewed when the NEA publishes a later full-year operating record, when IEA updates the supply-chain concentration or market-economics analysis, when Ember updates its China electricity-mix work, or when a significant policy change alters the current auction and market framework.
It should also be reviewed whenever the object changes. A new module revision, battery chemistry, inverter firmware, seller entity, origin route, project location, grid connection, offtake term, warranty party or service arrangement can change the evidence a buyer needs. A national transition can be stable in the aggregate while the decision file for one component or project changes completely.
Method and limitations
China Made & Tech prepared this as a desk-research guide using IEA analysis, China’s National Energy Administration record and Ember’s independent electricity analysis. The article does not claim that the team visited, tested, specified, bought, installed, operated, financed, commissioned, audited, contracted with or interviewed a factory, supplier, project developer, EPC contractor, grid operator, equipment maker, buyer or regulator.
The IEA’s manufacturing and market observations are used as dated analytical context. The NEA’s figures are used as national 2025 capacity and generation records. Ember’s figure is used as a separate, dated national electricity-share context. None establishes product quality, origin, supplier solvency, grid connection, project output, local compliance, cybersecurity, warranty performance, contract terms or the suitability of a particular component or site. Readers should match their next check to the technology, project, transaction and jurisdiction at issue.