

By China Made & Tech Team.
China’s high-speed rail network produces two phrases that are easy to repeat and easy to misunderstand: “8×8” and “50,000 km.” The first describes the backbone of a national railway plan adopted in 2016. The second is the Ministry of Transport’s record of operating high-speed railway at the end of 2025. Both are meaningful. Neither is a ready-made answer to the question a reader often has in mind: Can I actually take that train? Or, more analytically: What does this network say about a particular corridor, city or project?
The difference matters because a rail map combines several layers that look similar when they are drawn as lines. A policy plan names future or intended corridors. An infrastructure record counts railway length in operation. A service pattern tells us which trains run, when, and with what stopping pattern. An access layer asks how a passenger reaches a station and completes the last part of the trip. A corridor assessment asks still other questions: demand, cost, funding, governance, alternatives and public value.
China’s system is large enough that those distinctions deserve to be made carefully. The Ministry of Transport’s 2025 transport statistical bulletin records 50,000 km of HSR in operation at year-end, including 2,862 km put into operation during the year. That is a powerful description of national infrastructure scale. It does not establish that every planned line is open, that every open segment offers a direct train between two places, that every station is near its city centre, or that every corridor has the same passenger and financial profile.
This is therefore not a route planner and not a verdict on high-speed rail economics. It is a map-reading guide. It explains what the 2016 Eight Vertical and Eight Horizontal grid was designed to do, how the national operating record changed from 2017 to 2025, why a line on a diagram is not yet a usable journey, and what to check before turning a network image into a practical or policy conclusion.
Start with the map question, not the map image
The most useful question is not “Where are China’s bullet-train lines?” It is “What exactly does this map claim to show?” A reader may be looking at a national plan, a map of built infrastructure, a promotional network graphic, a timetable diagram, or a route search result. They can all use similar colours and lines. They are not interchangeable evidence.
Consider the difference between these statements:
- “This city pair appears in an 8×8 corridor.”
- “A railway segment exists between these places.”
- “A passenger train currently operates between these places.”
- “A passenger can make the trip directly, at a useful time, with a reasonable transfer and station-access burden.”
- “The corridor produces a desirable economic or social outcome.”
Each statement is stronger than the one before it. Each needs additional evidence. The first can be established by a planning document. The second requires an up-to-date infrastructure-status source. The third requires a live operating or timetable source. The fourth adds transfer, station and door-to-door information. The fifth requires a route-specific evaluation with methods and assumptions. A good network guide does not let a line silently jump from the first category to the fifth.
The 50,000-km figure is a good example. It says that China had a vast amount of operating HSR at the end of a stated year. It is not a national list of passenger journeys. The 2016 plan is also a good example. It gives an organising structure for the HSR system. It is not a certificate that every named corridor reached the same construction or service state by the end of its planning period.
This is not an argument for treating maps with suspicion. Maps are essential infrastructure tools. They make a national system intelligible. The discipline is simply to read a map with its source, date, legend and intended use still attached. Once those are detached, a planning diagram can become accidental travel advice, a mileage statistic can become a performance claim, and an elegant national graphic can carry conclusions it was never designed to carry.
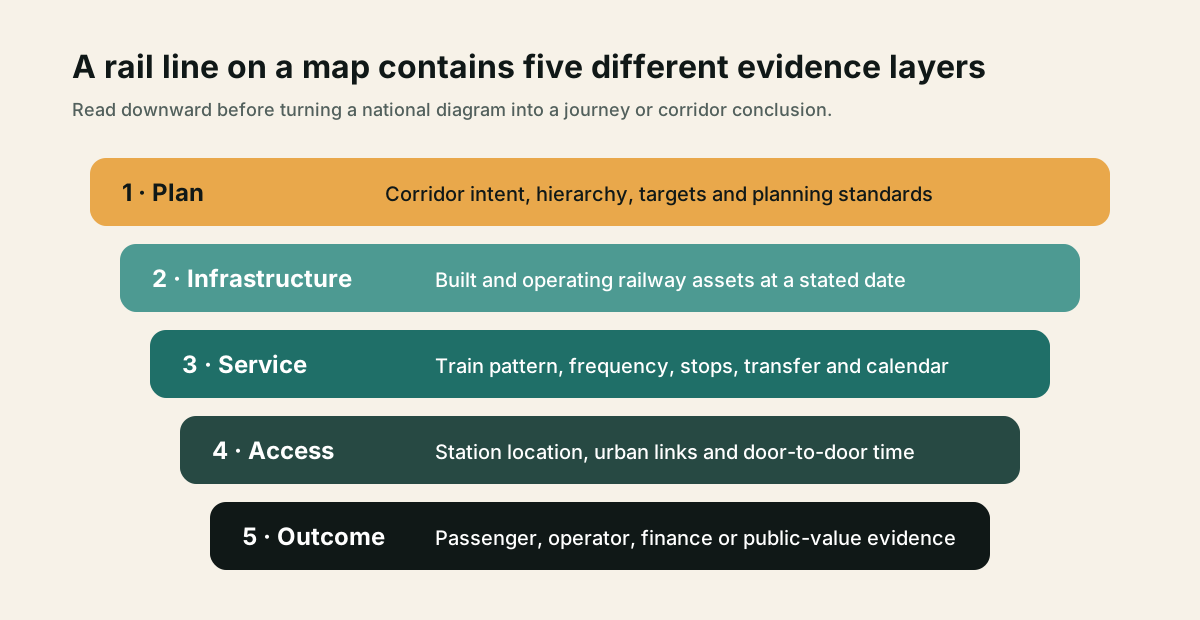
Five layers hidden inside a single rail line
The first layer is planning. Planning specifies a desired network structure, priority relationships, standards and long-term coverage ambitions. It is about where the system is intended to go and how its components should fit together. It may include targets that are later revised, sequenced differently, financed differently or implemented through different projects.
The second layer is infrastructure. This asks whether track, civil works, power, signalling and the rest of the physical system have been completed and put into operation. National operating mileage is an aggregate measure at this layer. It is useful for tracking expansion, but it cannot reveal the operational details of every individual segment.
The third layer is service. A railway can be in operation while the passenger offering differs by time of day, day of week, season, stopping pattern, through-running arrangement or train category. A network map generally does not describe those choices. A route claim should therefore be checked against current service information, not against the mere existence of a corridor line.
The fourth layer is access. Stations connect to cities through metro, bus, taxi, car, walking, cycling and other rail services. Their usefulness depends on location, transfer design, local transport, wayfinding, waiting time and the origins and destinations of actual passengers. The railway portion of a trip can be fast while the entire journey is not; the reverse can also be true in a well-connected urban station.
The fifth layer is outcome. A passenger may care about time and convenience. A public agency may care about capacity, inclusion, regional connection or emissions. An operator may care about fares, costs, asset condition and revenue. A lender may care about repayment and risk allocation. None of those outcomes is visibly encoded by a single national line on a map.
The habit of separating the layers has a practical benefit: it turns a vague fact-checking job into a short sequence. First identify the map’s issuer and date. Then ask whether it describes a plan, operating infrastructure or service. Then check the current route or journey through the relevant operational source. Finally, if a claim concerns money or public value, request the corridor-level evidence rather than arguing from the line colour.
What the 8×8 grid was designed to mean
China’s 2016 Medium- and Long-Term Railway Network Plan, published through the National Development and Reform Commission, is the primary source for the “8×8” phrase. The document states that the high-speed network would expand beyond the earlier four-vertical/four-horizontal framework to form eight vertical and eight horizontal main corridors. Those corridors were intended to be the backbone. The plan then adds regional railway connectors and intercity railways as separate layers.
That hierarchy is more revealing than a long list of corridor names. It says the national system was not conceived as a collection of isolated city-pair projects. Main corridors give the network long-distance structure. Regional connections add reach and links between the backbone and other places. Intercity rail focuses on city-cluster relationships and, in the plan’s terms, supports connections among large and medium cities and central towns. A reader looking at the 8×8 grid should see a hierarchy of functions, not a promise that every line serves the same market in the same way.
The plan also uses different planning standards for different layers. It says newly planned main-corridor projects would generally use standards of 250 km/h or more, while allowing a lower standard in difficult terrain, geology or climate conditions. It says regional connectors would generally use standards of 250 km/h or below, and intercity rail 200 km/h or below. Those statements are useful because they show that the categories were not merely graphic labels. They linked network role to an intended planning standard.
But the wording still has to be preserved. These are 2016 planning standards, not a present statement of the operating speed, stopping pattern or passenger experience on every route. A train’s maximum technical speed, a line’s design standard, a timetable’s scheduled speed and a passenger’s door-to-door travel time are different measurements. Treating them as one number is another way a map can mislead.
The planning horizon is equally important. The document identifies 2016–2025 as its plan period and provides an outlook to 2030. It sets national targets and describes desired coverage. That is exactly what a national spatial plan is supposed to do. It does not, by itself, settle what happened subsequently to each project, how service was organised, whether a through train runs over a corridor’s named components, or how a passenger reaches the station.
The 8×8 language is therefore best treated as an index. It is a way to locate a railway question within a national design: is the issue about a main north–south or east–west spine, a regional link, or an intercity layer? That index can guide further research. It cannot substitute for it. In particular, it should not be used as a current China high-speed rail route map without an additional source that specifies date, construction status and service information.
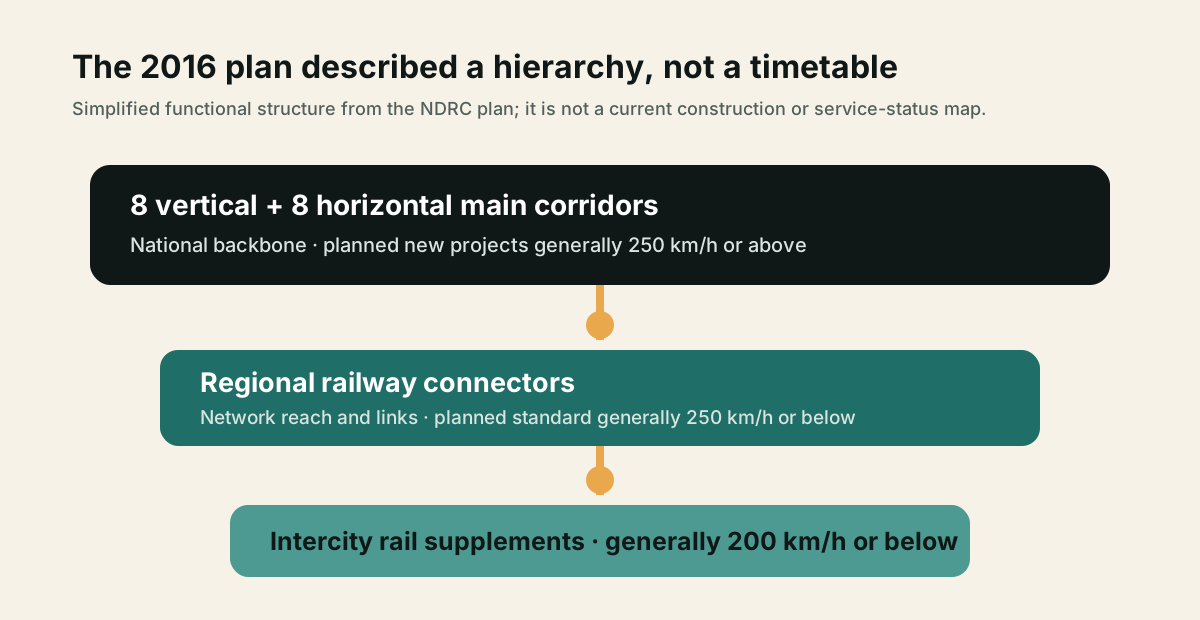
Why hierarchy matters more than an exhaustive corridor list
An exhaustive list creates an illusion of precision. It can make a reader feel that, once every city name has been attached to a coloured line, the network has been explained. In reality, a list can obscure the central design question: what role was a particular component supposed to play in the system?
The main-corridor layer is about national connectivity and trunk capacity. A regional connector can provide redundancy, reach, or a link between the backbone and a different urban or geographic market. An intercity railway can emphasise shorter-distance metropolitan interactions. Those are different service concepts. They can imply different station spacing, passenger patterns, operating needs, construction conditions and integration priorities. They should not be evaluated with a single generic phrase such as “high-speed rail line.”
The hierarchy also helps explain why the China HSR story has a geographic dimension without allowing a simplistic conclusion about every city. A national backbone can create more combinations of destinations, transfers and network effects than a set of standalone lines. Yet the benefit a particular city receives still depends on its place in the network, its local station access, the service it receives and the activities people actually undertake after arriving. The grid creates a possibility structure. It does not measure the realised value of each connection.
For a business reader, the same point applies to supply chains. A line in a national corridor may change the landscape of passenger movement, but a passenger HSR map should not be converted into a freight or industrial-logistics claim without separate evidence. Nor does being near a railway corridor prove that a factory, industrial cluster or city will benefit by a particular amount. China’s wider manufacturing pattern is better understood through the published background in How China Manufactures: Inside the World's Factory (2026) and China Industrial Clusters: A Buyer's Sourcing Map, which examine different evidence and mechanisms. Rail can be one part of an economic geography; it is not a shortcut around the rest of the analysis.
A corridor name is a network relationship, not a single piece of track
One reason the 8×8 grid is easy to misread is that a corridor name sounds like the name of one line. In a planning document, however, a corridor can be a relationship among multiple sections, cities and connecting functions. The 2016 plan itself describes some main corridors with branches and with use of existing railway sections. That is normal in a national network plan. The objective is to make a coherent path through a system, not to promise that every kilometre will be a newly built, uniform, stand-alone railway.
This has three implications for a reader trying to match the plan to a contemporary image. First, a corridor can be composed of sections with different histories. Some may have existed before the plan; others may have been proposed, upgraded or sequenced later. Second, a corridor’s label does not by itself identify the precise physical path shown by every third-party map. Mapmakers make choices about which branch, parallel route or city label to emphasize. Third, a corridor does not tell a passenger which train they will board. A service may use only part of the infrastructure, stop at different stations, continue beyond an administrative corridor, or require a transfer.
The distinction is especially important when a map uses an unbroken line. Continuous graphic design can imply a continuous passenger experience. In network planning, continuity can instead mean that the system is intended to support an end-to-end connection through linked components. That is a useful strategic concept, but it does not answer the operational questions of the day. A direct passenger train, for example, is a service decision; it cannot be deduced simply because two places sit on the same planned spine.
This is why the best way to use a corridor name is as a research key. It helps the reader find the relevant official plan, identify the broader network purpose and locate the component sections that need current checking. It should not be used as a shortcut for present condition. Once the question becomes specific—“is this segment open?” or “what is the fastest trip from this origin to that destination?”—the reader has moved out of the plan file and into infrastructure and service records.
There is also an institutional reason to preserve that boundary. Long-range national plans need to remain legible while projects, local priorities, funding constraints and construction conditions change over time. A plan that can coordinate the backbone of a very large country is valuable precisely because it works at a different level from the current timetable. Trying to make it do both jobs makes it less useful for either one.
A network growth record is not a route list
China’s operating-network timeline is striking even when it is read conservatively. The World Bank’s 2019 report, China’s High-Speed Rail Development, records more than 25,000 route-km of high-speed lines at the end of 2017. Its figure is historical and belongs to the report’s own network definition. The report is useful because it makes clear that the early network had already reached a scale large enough to be analysed as a system rather than as a handful of showcase lines.
The National Railway Administration’s 2024 statistical bulletin later records 48,000 km of HSR in operation at the end of 2024. The Ministry of Transport’s 2025 bulletin then records 50,000 km at the end of 2025, with 2,862 km of new HSR put into operation during that year. Together, the records describe rapid national expansion over time.
The figures should not be silently treated as a perfectly identical series. The World Bank’s historical discussion and map note define their own scope, while the 2024 and 2025 government bulletins are annual official records. A careful reader keeps the source attached to each point. The broad direction is clear: the national operating network expanded materially. The extra precision required for a particular route—what part is open, what train service uses it, and how it connects to a journey—belongs to another file.
| Date and source | HSR figure | What the record supports | What it cannot replace |
|---|---|---|---|
| End-2017, World Bank historical analysis | More than 25,000 route-km | Historical scale of the earlier network | A current route-status or timetable source |
| End-2024, National Railway Administration | 48,000 km in operation | Dated national operating network size | A city-pair service or station-access claim |
| End-2025, Ministry of Transport | 50,000 km in operation | Current national operating network size | A direct-train, journey-time or corridor-outcome claim |
| Calendar 2025, Ministry of Transport | 2,862 km new HSR | National annual HSR added to operation | A list of the specific passenger journeys made possible |
The word network can encourage an overreach here. A network is not just the sum of lines; it is also the way lines connect. Yet a national total tells us very little about how any particular connection works in practice. Two travellers may both start in cities shown on the same major corridor but face very different experiences depending on station location, departure times, transfer patterns and destination access. The national graph and the passenger itinerary are related but not equivalent.
This is why “China has 50,000 km of HSR” is a solid opening fact but a poor final conclusion. The value of the fact is that it directs attention to a system of exceptional scale. The task after that is to decide which layer of the system the reader actually needs to investigate.
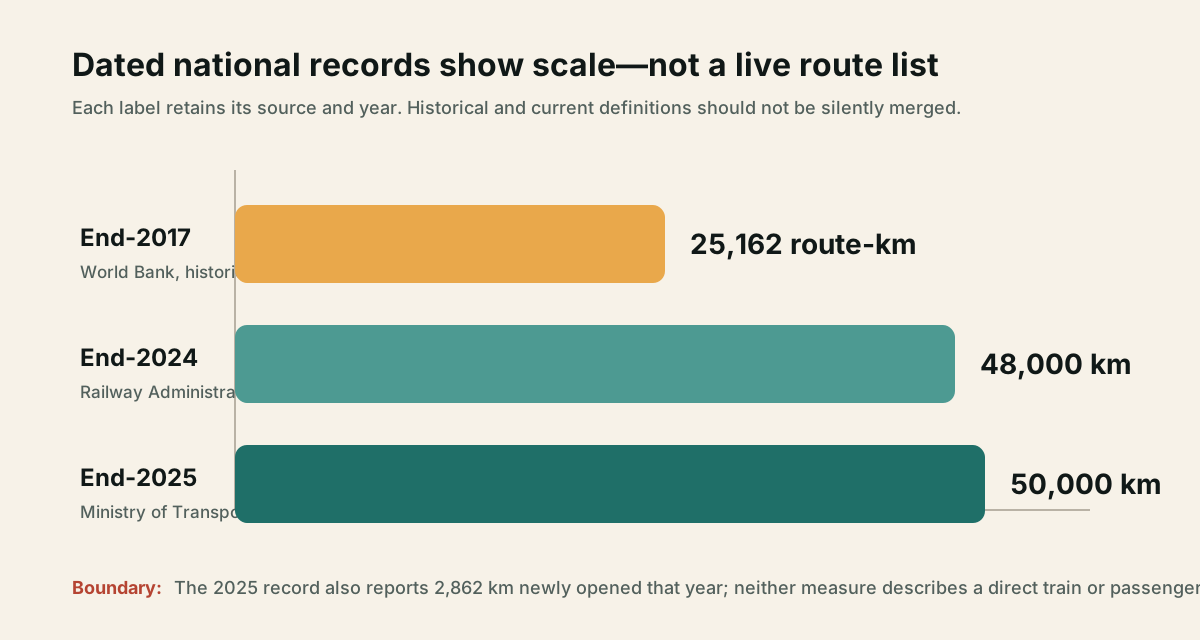
Why the definition beside the number matters
Railway statistics are especially prone to false precision because the unit looks universal. A kilometre appears to be a kilometre. Yet the meaning of the number depends on the network definition, the reporting institution, the reporting date and the operational state that the issuer has chosen to count. The World Bank’s historical map note explicitly includes 200 km/h mixed-traffic lines in the report’s HSR scope. The NDRC plan, meanwhile, distinguishes new main-corridor projects, regional connectors and intercity rail by planning standard. The Ministry and the regulator report national operating HSR length in their own annual records. These are compatible pieces of context, but they are not an invitation to erase their different purposes.
For that reason, the table above should be read as a record trail, not as a stopwatch. It shows that the network grew from a historical 2017 scale above 25,000 route-km to the current official 50,000-km end-2025 figure. It does not establish a precise annual growth rate or an exact like-for-like comparison across every map convention. An analyst calculating a growth rate, a completion ratio or a technology comparison should obtain the underlying definitions and verify whether the series is harmonised before doing the arithmetic.
The same caution applies to claims about coverage. A national plan may describe the aspiration to connect provincial capitals, major cities or city clusters. An operating-mileage statistic counts track in service. Neither is identical to a statement that every resident is within a certain travel time of a station, that every city pair has frequent direct trains, or that a line offers the same level of service at every point along a corridor. Coverage is not a single variable. It can refer to territory, population, administrative units, stations, services, departure frequency or practical access. A reader should ask which one the source means.
That question becomes even more important when the map is used in a comparison with another country. Countries define high-speed rail, railway opening and corridor coverage differently; their urban form, station location, network age, service patterns and reporting systems differ as well. A visually simple comparison of line length can be informative as a statement of broad scale. It becomes weak when it is made to stand in for accessibility, capacity, cost, speed, reliability, environmental effect or investment value without matching evidence for each measure.
The discipline may sound cautious, but it produces a more interesting account of China’s network. It lets the reader see both the remarkable national expansion and the specific organisational choices hidden beneath a single public number. It also makes later research faster: once the intended question is clear, the reader knows whether to look for a plan, a construction notice, a current service search, a station-access study or a corridor appraisal.
From a drawn line to a usable journey
The move from infrastructure to passenger use is where many seemingly detailed maps become thin. It is tempting to think that once a city is attached to a high-speed corridor, the practical travel question has been answered. But a journey has a chain of components: getting to the origin station, navigating the station, boarding the correct service, making any transfer, arriving at the destination station and getting to the final destination. Each component can change the value of the trip.
The World Bank report supplies a useful historical warning about this. Its HSR network mapping includes 200 km/h mixed-traffic lines in its stated scope. That does not make the map wrong; it makes the legend important. A reader who assumes every line in the drawing means the same kind of infrastructure or service will draw an incorrect conclusion. The report also notes that some HSR stations are located outside city centres, which adds connection time. That observation does not tell us which current station is convenient or inconvenient. It shows why the station must be treated as a distinct analytical object.
Infrastructure is a necessary layer, not the final layer
An operating line establishes an important fact: the underlying railway infrastructure is available for use within a defined network. But passengers do not consume a kilometre of railway in the abstract. They consume a service at a time and a place. A line may host different train patterns, different stopping choices and different transfer possibilities. It may connect two places physically while the practical trip still requires a wait, a change of train or a lengthy local transfer.
This matters even for readers who are not planning a trip. Service design affects the system’s value. Frequent, clear and well-integrated service can make an existing asset useful to a much wider share of a market. Infrequent or poorly connected service can leave the physical route underused by the people a map viewer imagines will benefit. The point is not that China’s network has one or the other problem. The point is that the operating question cannot be answered by a national map alone.
To research a city pair, a reader should therefore look for a source that is meant to answer a service question: an official timetable, an operator search tool, a current station page or a verified route planner that makes date and service constraints clear. Even then, the result must be read in time. Train service changes. Engineering works, seasonal demand, operating schedules and commercial decisions can change a service pattern. A current route search is an answer for a given date, not a permanent property of a coloured corridor line.
The station is not a dot
Station access is often treated as an afterthought because it is hard to show at national scale. But it can influence the whole passenger proposition. A central terminal with good local transport connects differently to a peripheral station reached by a lengthy road trip. An interchange can be effortless when platforms, signs, ticketing and urban links work together, or burdensome when they do not. The same rail journey time can yield very different door-to-door experiences.
The World Bank’s historical observation about some stations outside city centres belongs here. It is not a city-by-city diagnosis; it is a reminder to ask a local question after reading a national map: where is the station relative to the trip’s true origin and destination? That question applies to every country with high-speed rail, airport links, commuter rail or new peripheral development. It is especially relevant when a network graphic has conditioned the viewer to see cities as abstract points rather than as large urban areas with diverse travel patterns.
There is a second access question: can the passenger transfer into the rest of the network easily? National connectivity is powerful when a traveller can combine services without excessive friction. But connectivity depends on timetable coordination, transfer duration, station layout, ticketing rules, baggage needs, local transport and the reliability of each part of the trip. None of these can be inferred from the number of main corridors alone.
A route question has a verification sequence
When someone asks, “Does China’s HSR connect A to B?”, the answer should first be translated into a more specific question. Do they mean that a planned corridor includes both places? That an HSR segment has been constructed? That a train runs between them on a particular date? That it is direct? That it is the fastest or most convenient option? Or that the connection has changed the economics of the pair? Those are distinct questions with distinct sources.
The following sequence keeps the inquiry grounded:
- Identify the map source, date and legend. Is the map a 2016 plan, a historical research figure, an official operating map or a third-party travel graphic?
- Check the current line status. Do not use the plan’s corridor name as proof that every component is open.
- Check the actual service. Look for current trains, calendar date, stopping pattern and whether a transfer is needed.
- Check station and transfer access. Add the beginning and end of the door-to-door trip, not only the rail segment.
- Check the claim’s intended outcome. If the question concerns time, cost, passenger demand, city development or finance, obtain evidence designed for that outcome.
That sequence may feel less satisfying than one bright map with every answer in it. It is more useful. It lets a reader use the national network as context while still respecting the fact that an actual journey is a service problem.
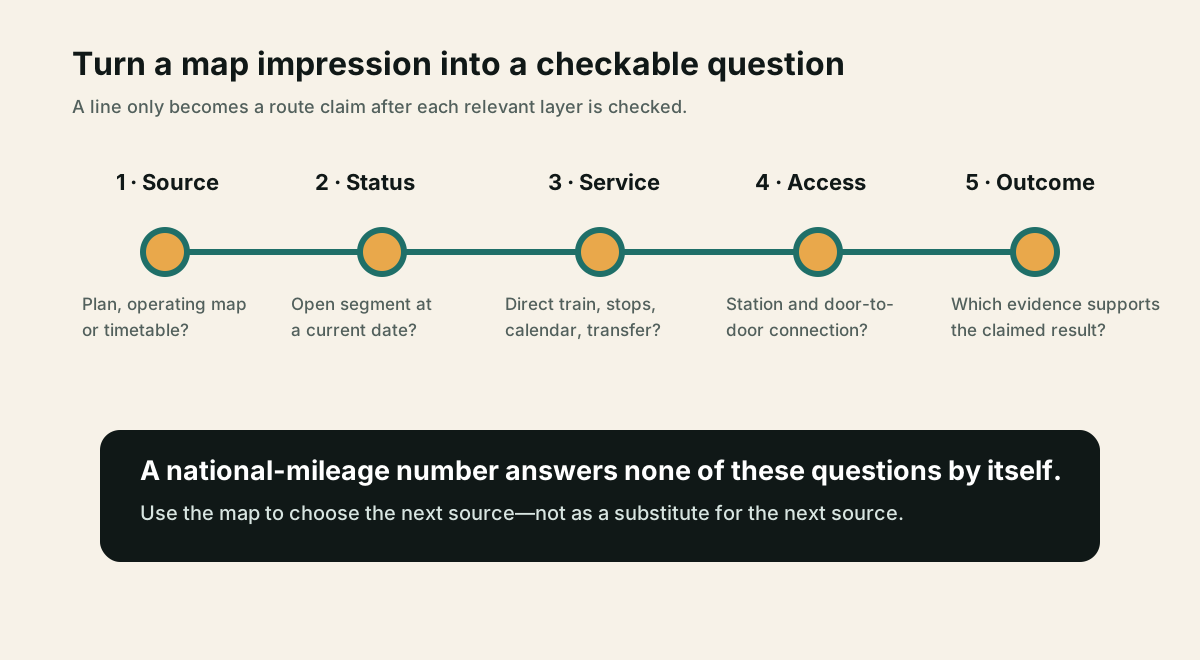
The corridor file: what a national network cannot decide
The map-reading framework also protects against a second kind of overreach: turning China’s network into an automatic verdict on a proposed railway elsewhere. A 50,000-km national operating record can demonstrate that China built and operates a very large HSR system. It cannot demonstrate that another corridor, in another institutional setting and passenger market, should be financed, built or operated in the same way.
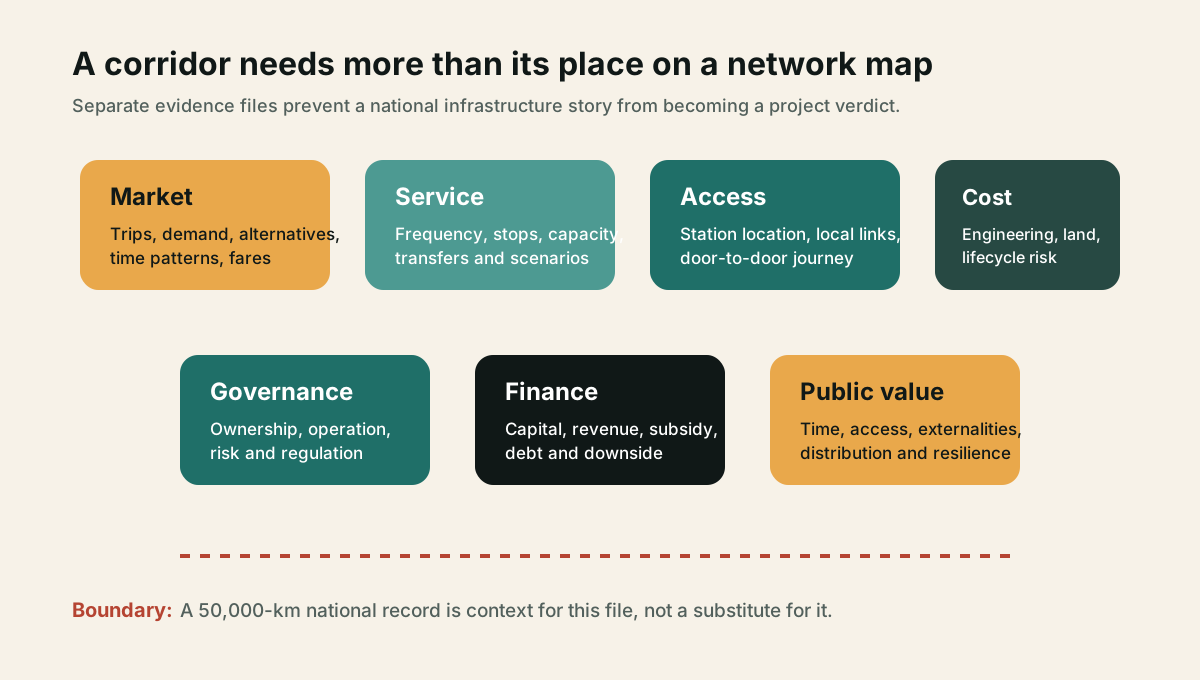
That conclusion needs an evidence file at the corridor level. The file should be assembled around the decision being made rather than around a desire to copy a map. At minimum, it has seven parts.
1. The market file
Who travels between the relevant places today, and who is expected to travel in the future? The question is not just population. It includes trip purposes, time of day, income and fare sensitivity, origins and destinations, intermediate markets and the alternatives people already use. A demand forecast needs transparent methods, scenarios and sensitivity tests. A national HSR length statistic cannot replace any of those inputs.
2. The service file
What timetable, frequency, stopping pattern, rolling-stock capacity and transfer design would the corridor offer? The passenger value of rail comes from a service configuration, not merely a technical speed label. The service file should show how the schedule fits the market file and how it changes under lower or higher demand. It should identify what happens if planned frequency cannot be sustained or if a line must operate with a different stopping pattern from the initial concept.
3. The access and integration file
Where are stations located? How will passengers reach them? How do local metro, bus, walking, road access, parking, airports and legacy rail interact with the new service? What transfer penalties and waiting times are assumed? These questions are as consequential for public usability as the main-line travel time. They also determine whether a corridor connects urban centres, peripheral development or both.
4. The engineering and cost file
What terrain, structures, land, utilities, geotechnical risks, power needs, signalling requirements and construction constraints define the project? What is the capital-cost estimate, its contingency, its inflation assumption and its risk allocation? What maintenance and renewal costs are expected over the asset life? A national Chinese mileage figure says nothing about the cost of a different geography or procurement environment.
5. The operating and governance file
Who owns the assets, who runs the service, who controls timetabling and dispatching, and who carries revenue, maintenance and lifecycle risk? How will safety regulation, performance monitoring and asset stewardship work? The Chinese experience is relevant as a reminder that networks need institutions as well as track. It is not evidence that a foreign governance structure has the same capacity or incentives.
6. The finance file
Where does capital come from, on what terms, and who bears downside risk? What fare revenue is realistic under the service and demand assumptions? What subsidies, guarantees, land-value mechanisms or cross-support are contemplated? A finance file should make the relationship between debt, equity, public support, revenue and lifecycle costs legible. It should not be filled with national-network rhetoric.
7. The public-value file
What broader effects matter for the decision, and how will they be measured? Depending on the jurisdiction, this can include time savings, safety effects from mode shift, emissions, congestion, accessibility, resilience, regional-development mechanisms and distributional impacts. These effects must be distinguished from the operator’s income statement. A project can have a different financial and public-value profile; neither can be assumed from a route’s place in a national plan.
The value of the Chinese case is not that it removes the need for these files. It makes their absence more visible. A national programme at very large scale still consists of corridors, stations, services and institutions. The more impressive the network graphic, the more disciplined the reader should be about asking which file supports the claim at hand.
How to use the 8×8 grid responsibly
The 8×8 grid is worth learning because it gives a compact language for China’s national HSR ambition. It reveals an effort to organise long-distance spines, regional connections and intercity layers into a system. The 2017, 2024 and 2025 records are worth learning because they show that the physical operating network grew from more than 25,000 route-km in the World Bank’s historical 2017 account to 48,000 km at the end of 2024 and 50,000 km at the end of 2025 in official records.
Used together, those sources can support a strong but bounded statement: China planned and built a national HSR system at exceptional scale, and its operating network continued to expand into 2025. They cannot support a route-by-route travel guide, a claim that a corridor is direct or convenient today, an assessment of whether a particular station works for a city, or a conclusion about the financial and social merits of every line.
That limitation does not make the network less interesting. It makes the question more interesting. Instead of asking a map to do every job, a reader can move deliberately from one layer to the next: from plan to infrastructure, from infrastructure to service, from service to access, and from access to the specific outcome they care about. That is how a large national diagram becomes a useful research starting point rather than a substitute for research.
Method and limitations
This is a desk-research article. It uses the National Development and Reform Commission’s 2016 railway-network plan for the meaning of the 8×8 hierarchy; the World Bank’s 2019 report for historical network and map-scope context; the National Railway Administration’s 2024 bulletin and the Ministry of Transport’s 2025 bulletin for dated national operating records. It does not rely on first-hand travel, route mapping, station inspection, timetable testing, engineering review, project-finance analysis or passenger interviews.
Accordingly, this article does not state whether any named route is open, direct, fast, safe, accessible, profitable or advisable. It does not estimate debt, city development, migration, economic return or export suitability. For a current journey, consult a source designed to show current service for the travel date. For a project or corridor decision, use the separate evidence files described above and verify their methods, date, scope and assumptions.
Sources
- National Development and Reform Commission — Medium- and Long-Term Railway Network Plan (2016)
- World Bank — China’s High-Speed Rail Development (2019)
- National Railway Administration — 2024 National Railway Development Statistical Bulletin
- Ministry of Transport — 2025 Transport Industry Development Statistical Bulletin