
By China Made & Tech Team. Independent English field guide to China's niche hardware brands, hidden champions, founders, factory towns, and supplier clusters.
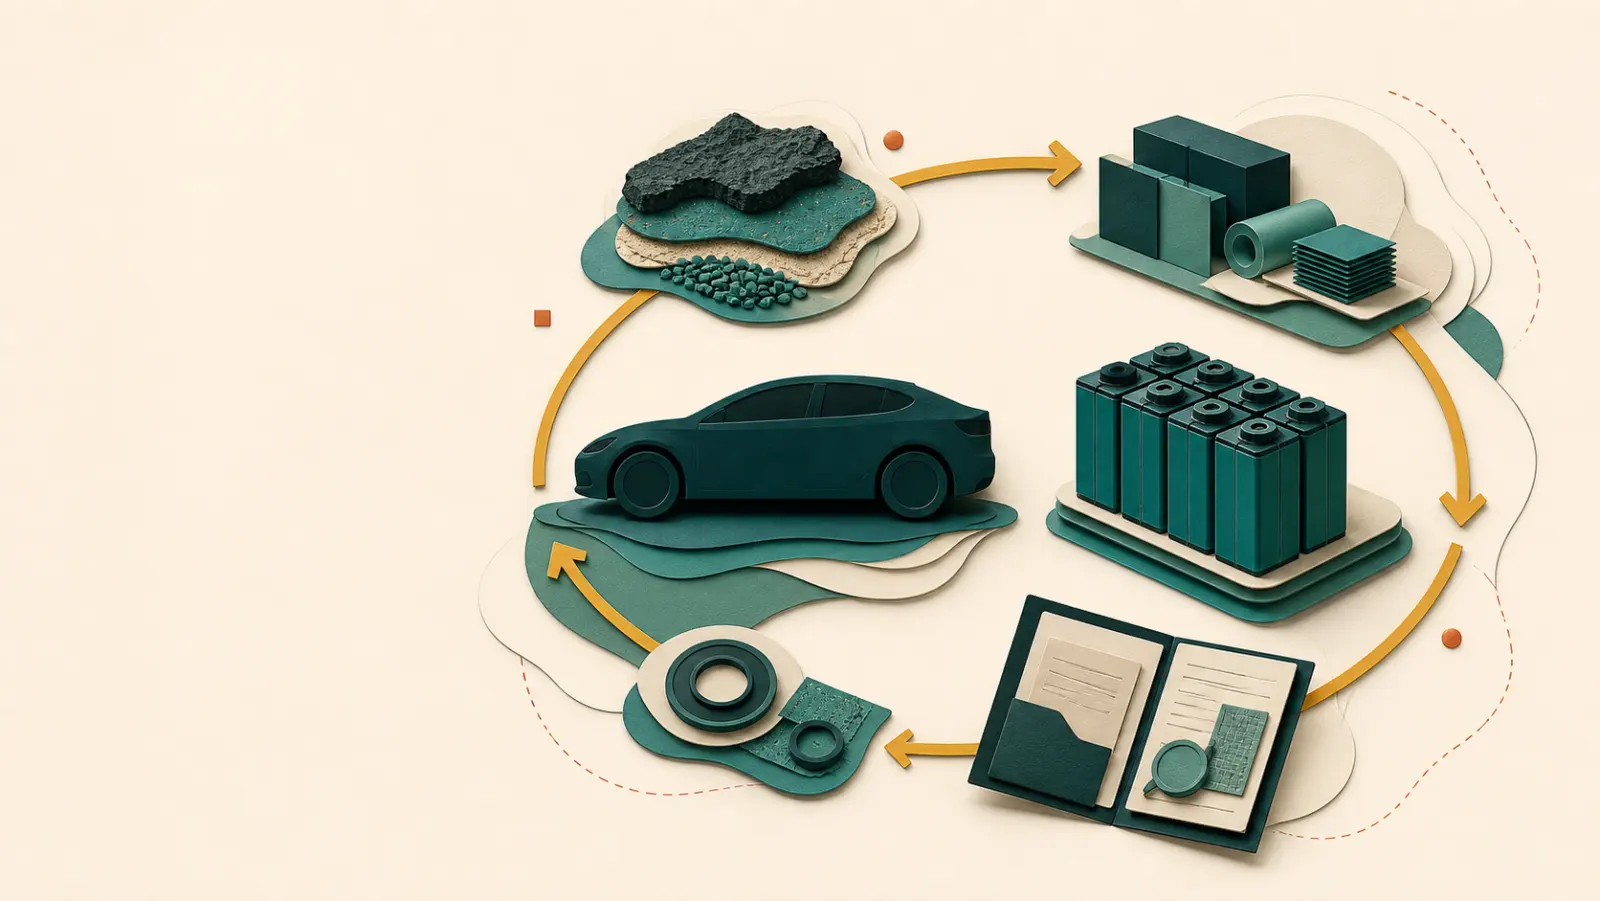
China’s EV and battery industry is not two parallel stories. It is one feedback loop with several different measuring sticks. Domestic electric-car sales create a large market for vehicle programmes. Those programmes draw on batteries, cells and materials. Manufacturing depth makes faster iteration possible. Exports carry part of the resulting output into other markets. Each step changes the next one—and each step answers a narrower question than a headline about “China’s lead” usually suggests.
The numbers are large enough to make that distinction worth getting right. The International Energy Agency (IEA) says China sold more than 13 million electric cars in 2025, with electric cars accounting for almost 55% of new-car sales in its measure. China’s Ministry of Industry and Information Technology, meanwhile, records 16.626 million new-energy vehicles produced and 16.49 million sold in 2025. Those are related facts, but not interchangeable ones: the IEA’s electric-car market measure and the official NEV category use different definitions and should not be added together.
That is the organising principle for this guide. China’s scale changes the range of vehicles, batteries, supply-chain choices and market pressures that global readers encounter. It does not establish the safety, quality, price, origin, delivery, warranty, compliance or suitability of one vehicle, cell, pack, supplier or storage project. The useful next step after an industry headline is not a verdict. It is a better evidence request.
The first mistake is looking for one China number
An electric-car sales number describes demand in a defined market and period. A vehicle-production number describes factory output. A battery-deployment number describes batteries placed into EVs. Cell and material production shares describe industrial supply. An export figure describes a border-crossing outlet. A battery-usage tracker describes a particular installed or registered-use denominator. They form a connected picture, but none is a substitute for another.
The table below is a practical way to keep the system readable.
| Measure | What it helps explain | What it cannot establish |
|---|---|---|
| Electric-car sales | The size and pace of domestic end-market demand | NEV production, battery-cell origin or a supplier’s performance |
| NEV production and sales | The official Chinese automotive-industry record | The IEA’s electric-car category or a battery-deployment total |
| EV battery deployment | How much battery energy was deployed into EVs | Cell manufacturing capacity, product quality or commercial allocation |
| Cell and material production shares | Where industrial depth is concentrated | The factory, revision or origin of a quoted pack |
| Electric-car exports | One route by which output reaches foreign markets | Overseas registrations, inventory turnover, margins or local support |
| Registered battery usage | A time-bounded picture of manufacturers’ role in a tracker | A full-year forecast, product test or company-quality ranking |
The feedback-loop frame gives the system a concrete protagonist: the vehicle and battery programme trying to move from a domestic product requirement to volume production and, in some cases, to a global market. Its environment is unusually dense. It includes OEMs, battery makers, cell plants, cathode and anode materials, equipment suppliers, power-electronics providers, pack integrators, dealers, charging or service partners, and export channels. Its obstacle is equally concrete: scale can create learning and optionality, but price competition, inventory, overseas market conditions, local assembly, product revisions and support obligations all prevent scale from becoming a guaranteed commercial outcome.
Start where the loop starts: domestic product demand
The domestic market is the first half of the battery story. More than 13 million electric cars sold in China in 2025 is not simply a ranking statistic. It means a very large number of customers, vehicle configurations, charging patterns, software updates, model launches and battery choices are being tested by the ordinary pressures of a mass market. The IEA also describes a Chinese market with close to 700 electric-car models available by the end of 2025. That model variety matters because battery and vehicle systems learn through product programmes, not through a national total alone.
Think of a passenger EV programme as a recurring design problem. An OEM chooses a segment, price band, range target, charging strategy, cabin and cargo packaging, powertrain, battery form factor, thermal architecture, software behaviour and supplier mix. A programme that sells in volume creates demand for cells, packs, electronics and materials that fit those choices. Suppliers then have incentives to improve yield, lower cost, change packaging, adapt chemistry, build tooling and negotiate capacity around the next programme. The next vehicle is not automatically better. But it is designed in an environment where the feedback from the previous programme is close at hand.
The official NEV record tells a related manufacturing story. The MIIT’s 2025 numbers—16.626 million NEVs produced, 16.49 million sold and a 47.9% share of new-vehicle sales—show that battery-equipped vehicles are no longer a small experimental corner of the Chinese auto market. Yet the category label matters. “NEV” is a Chinese policy and industrial-statistics category; it is not a magic synonym for every electric-car measure used by every global tracker. A reader should keep the agency, category, period and denominator attached to the number.
This is also why domestic demand cannot be reduced to a consumer-preference story. The market gives manufacturers a proving ground for low-cost city cars, larger family vehicles, premium models, plug-in hybrids, fleet products and the charging and service arrangements surrounding them. It creates pressure to bring models to market quickly and to keep changing them. That can shorten learning cycles. It can also create a difficult price environment in which volume does not translate neatly into margins. The existence of a vast domestic market tells you why China has a deep vehicle-and-battery ecosystem. It does not tell you who captures the value in that ecosystem.
For a global reader, the immediate consequence is more specific than “China is ahead.” A product appearing on a foreign showroom floor, in a fleet bid or in a storage quotation may be the downstream result of a domestic programme ecosystem with many more model variations, battery choices and supplier relationships than are visible in the export market. That makes it worth asking which exact programme and configuration you are looking at. It is not a reason to infer that a foreign-market version has the same price, software, warranty, parts availability or regulatory pathway as its domestic cousin.
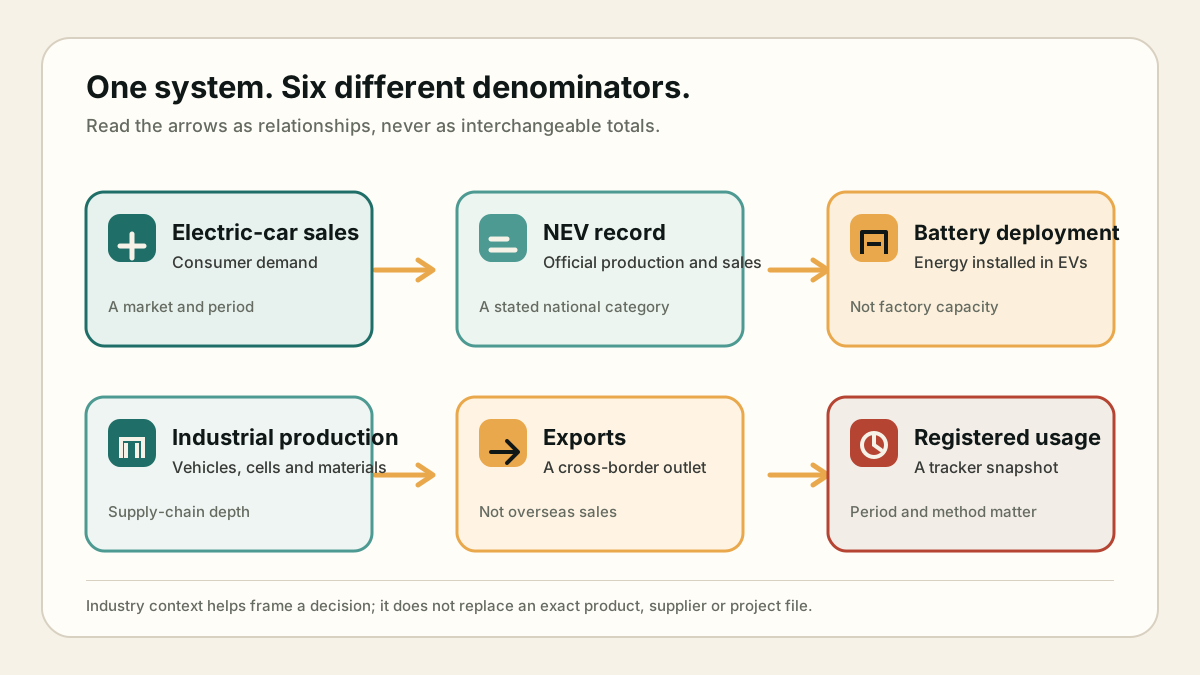 A field-guide diagram based on the market and industry measures discussed in this article.
Battery scale is not one number either
The battery layer makes the distinction even more important. The IEA reports 1.2 TWh of global EV battery deployment in 2025, with China accounting for about 60% of that deployment. This is a measure of battery energy deployed into EVs. It tells the reader that China is central to the current demand side of the global EV battery system. It does not tell the reader the name of every cell maker, the chemistry of every pack, where each cell was made, or whether a particular vehicle’s battery has the right performance for a route or climate.
Battery deployment sits between the vehicle market and the factory network. A vehicle sale usually translates into a battery installed in a vehicle; a vehicle programme shapes the kind of pack and cells needed; the resulting demand flows backward into cells, electrodes, active materials, equipment and pack assembly. But the link is not one-to-one. Battery sizes differ sharply across vehicle classes and regions. Plug-in hybrids and battery-electric vehicles carry different amounts of energy. A pack may use different formats, chemistry variants and integration strategies even within one model family. The same 1.2 TWh denominator cannot be turned into a car count, a factory utilisation rate or a bill of materials for a quoted product.
The manufacturing context is nevertheless striking. The IEA estimates that China accounted for about 70% of global electric-car production in 2025, more than 80% of battery-cell production, around 85% of cathode-active-material production and more than 90% of anode-active-material production. Those manufacturing and material shares help explain why a design decision in Chinese batteries can matter well beyond China. They locate much of the system’s industrial depth near the place where a large share of the end-market learning is happening.
That is the economic logic of the feedback loop. Demand gives OEMs a reason to launch and revise products. Vehicle programmes create a visible pipeline for cell, pack and material suppliers. Scale can help specialists build equipment, improve process control, qualify additional suppliers and learn which configurations can be manufactured repeatedly. A denser supplier network may then reduce the time between an engineering change, a sample, a production decision and the next model programme. The system can be especially powerful when battery design, vehicle packaging and material supply are coordinated rather than separated by long, slow hand-offs.
But “can” matters. Industrial depth is not a guarantee of actual output at a particular moment. The IEA notes that a battery plant can take more than five years to reach nominal capacity. That observation is a useful antidote to the habit of treating announced gigawatt-hours as batteries already available to buyers. Nameplate capacity, observed production, allocation to a customer, delivered cells and usable packs are a chain of different facts. A product decision should travel through that chain with documents, dates and configuration identifiers—not leap over it because the national capacity story is impressive.
The same boundary applies to materials. Cathode and anode production shares describe where key parts of the battery supply chain are concentrated. They do not establish the origin of a specific cell or pack. Real products often cross jurisdictions through mining, refining, precursor processing, active materials, cell manufacturing, module assembly, pack integration and vehicle assembly. If origin, local-content rules, transport classification or procurement restrictions matter, a reader needs a chain-of-custody or transaction-specific record. An industry share is context for the question, not the answer.
This is the point at which China’s industrial clusters become relevant. Dense clusters can make it easier to find tooling, materials, electronics, pack components, contract manufacturers and engineering talent in a category. They can help a programme move quickly. They are discovery and iteration infrastructure, not a factory audit. The closer the reader gets to a real product decision, the more the cluster story must give way to factory, configuration, test, warranty and service evidence.
The crucial hand-offs happen inside the product architecture
An industry system does not create a battery outcome directly. It creates a sequence of hand-offs inside an actual product programme. That is where the feedback loop becomes concrete.
First comes the cell. A cell choice is a materials and electrochemistry decision, but it is also a manufacturing decision: a producer needs a process that can make the chosen form factor at a stable enough yield, with the intended quality controls and an input supply that matches the programme. Then comes the pack. It adds electrical connections, sensing, contactors, fuses, a battery-management system, thermal interfaces, enclosure design and service access. Finally comes the vehicle or stationary system, which decides how the pack is packaged, charged, cooled, protected, monitored and supported in the field.
Each hand-off adds value and removes the usefulness of a generic headline. “Chinese cells are widely produced” may be relevant to the first layer. It says little about the pack’s thermal path, BMS revision, crash integration, operating limits or service procedure. “A vehicle uses LFP” identifies a chemistry family. It says nothing conclusive about the cell format, charge curve, repair access, warranty conditions or how the vehicle responds in a particular climate. At the system layer, the reader is no longer choosing a national industry; they are evaluating an integrated object with a date, a configuration and a responsibility chain.
| System hand-off | What the industrial loop can make more available | The decision evidence that still has to follow |
|---|---|---|
| Materials to cell | More options for active materials, suppliers and production learning | Cell identity, specification, production status and applied test scope |
| Cell to pack | More possible packaging, integration and cost choices | Pack revision, thermal design, BMS functions and protection architecture |
| Pack to vehicle or storage system | More ways to position range, charging, performance and price | Exact configuration, duty cycle, controls, vehicle/system integration and acceptance evidence |
| Factory to customer | Potential scale, alternative supply and faster revisions | Actual allocation, lead time, change control, warranty counterparty and service route |
| Domestic programme to export market | A product and supplier base that can seek overseas outlets | Local certification, importer, parts, diagnostics, software and support evidence |
The same logic applies to passenger EVs, even when much of the control software is not visible to the owner. Battery performance is an interaction among the cell, pack, vehicle controls, charging equipment, ambient conditions and permitted operating window. A large industrial base can help manufacturers develop and revise those interactions quickly. It cannot remove the trade-offs. Greater integration can free up packaging space and reduce some layers of material, for example, while making service or repair questions more consequential. A lower-cost cell can help a vehicle meet a price target while leaving a different range, power, cold-weather or support question for the finished product.
This is why the phrase “battery technology” should not be heard as a single thing. In the Chinese EV and battery industry, the system advantage lies partly in the ability to connect many specialist layers around a vehicle programme. The reader’s advantage lies in asking where the connection has been documented. If the seller can point only to a chemistry label, a national production statistic or a brand announcement, the system hand-off remains unproven.
How the feedback loop compounds—and where it breaks
It is tempting to describe the loop as a virtuous circle and stop there: more domestic demand creates more production, which produces better products, which creates more demand. That version is too smooth to be useful.
The real system is a set of reinforcing pressures. A manufacturer trying to sell a vehicle into a price-sensitive Chinese segment may want a pack that meets a cost target, fits a given floorpan, charges within a marketable window and can be supplied in volume. The battery maker may respond with a different cell format, chemistry mix, pack architecture or commercial arrangement. A material supplier sees demand for a certain active-material family. An equipment company sees an opportunity to improve formation, coating, welding or inspection processes. Those changes can bring down cost, improve manufacturability or make a new product form possible. They can also introduce new complexity, reduce repairability, create supply dependencies or increase the importance of software and quality control.
The next turn of the loop is therefore not “China makes more, so China wins.” It is “the system gives participants more chances to learn under volume conditions, while also forcing them to solve margin, differentiation, service and quality problems repeatedly.” China’s EV price competition is evidence of that pressure. It is not a footnote. A competitive market can drive rapid product iteration, but it can also compress the room available for a producer, dealer or supplier to earn a comfortable return.
This is where batteries become more than a component. A pack influences vehicle cost, interior and underfloor packaging, range, charging claims, thermal behaviour, service procedures, supplier bargaining and how a model can be positioned against rivals. Battery choices feed directly into vehicle programmes; vehicle programmes feed directly into battery demand. The feedback loop is real because the connection is operational, not merely statistical.
It also explains why a global reader may see Chinese vehicles and battery systems change quickly. A model refresh might involve new cell suppliers, a revised pack, different charging hardware, altered software logic or a new trim strategy. In a market where competitors are launching frequently, the commercial value of moving from a design change to an available product can be high. Yet “fast iteration” is not a product benefit by itself. A faster model cycle can create a better fit for a market; it can also make it more important to confirm the revision, the test scope, spare-parts continuity and the warranty counterparty attached to the exact item.
For battery readers, chemistry is one system layer, not the entire story. LFP, sodium-ion, high-nickel lithium-ion and solid-state development may alter the range of options available to an OEM or storage integrator. Cell format, pack integration, thermal control, BMS software, duty cycle and service support determine how those options become a finished product. The feedback loop makes more choices commercially relevant; it does not erase the engineering work needed to compare them.
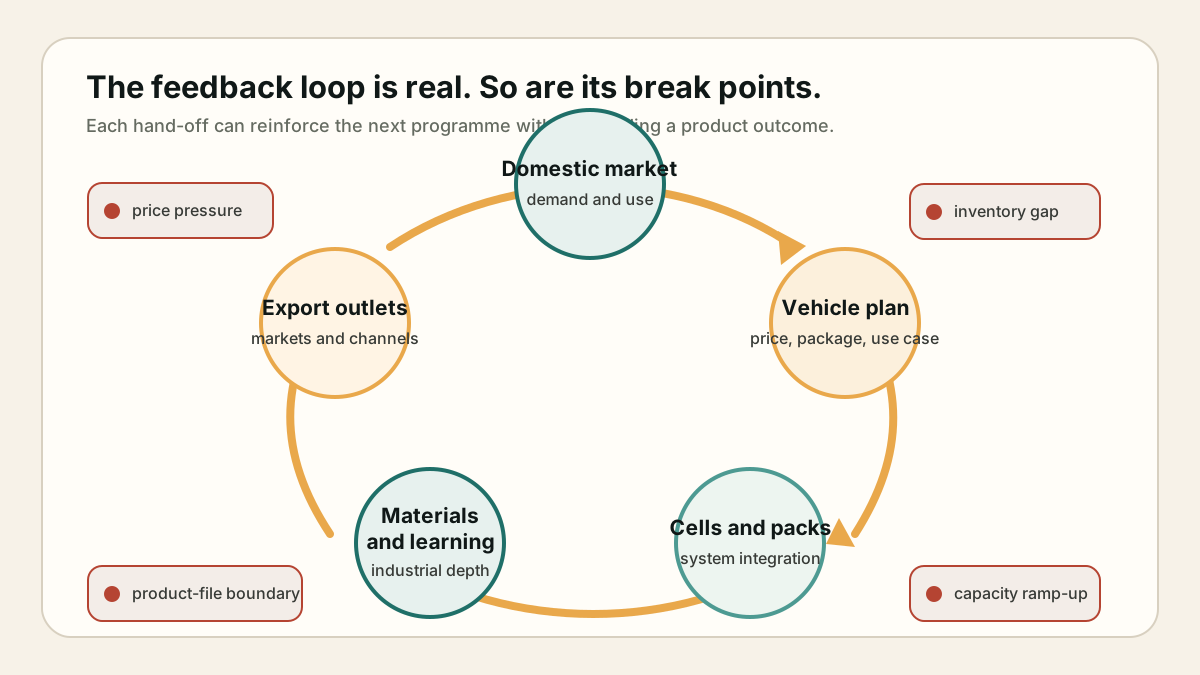 The loop explains connected layers; the coral markers show where a headline still needs a separate question.
Exports are an outlet, not a verdict on foreign markets
Exports are the most visible global extension of the loop. The IEA reports Chinese electric-car production near 16 million in 2025 and electric-car exports above 2.5 million. Those quantities show that China’s vehicle system is not confined to domestic demand. Exports can carry cars, and therefore battery systems and upstream industrial influence, into more markets. They can also change the competitive reference point for prices, model availability, features and local manufacturing decisions.
But the export number has a built-in warning. In the IEA’s analysis, CAAM-reported Chinese electric-car exports exceeded estimated overseas sales by more than 25% in 2025, a gap the agency says is consistent with inventory build. The export and inventory discussion is precisely why border-crossing volume should not be described as an end-market result. A vehicle can be shipped before it is registered, held in inventory, redirected to another market, re-exported, discounted or supported by a local production strategy rather than a direct-export strategy.
The distinction changes the questions a global reader should ask. If you are an analyst, it directs attention to registrations, inventory, channel health, localisation and pricing rather than shipments alone. If you are a dealer or fleet buyer, it directs attention to the specific importer, parts warehouse, warranty counterparty, diagnostic tools and repair path in your own market. If you are a policy or sourcing reader, it directs attention to the vehicle’s actual supply chain and legal documentation rather than a national export headline.
Regional outcomes also differ because market structures differ. Some places have mature domestic automakers, local-content incentives, tariff regimes, charging patterns or consumer preferences that make local assembly and localisation more important. Other places may be served initially by imports. The presence of a Chinese vehicle in a market tells you there is an entry route; it does not tell you whether the brand has a durable service network, the same domestic feature set, the same price position or the same residual-value experience there.
Margin is another boundary. The IEA’s manufacturing and trade chapter describes price pressure and tight profitability in the electric-car sector. This matters because export growth is often narrated as a pure expansion story. In practice, companies can pursue volume, utilisation, brand discovery, dealer relationships, regulatory learning or market position while still facing difficult economics. The reader should resist treating a large export flow as proof that every participant is profitable, stable or capable of supporting every product line indefinitely.
The systems perspective is still useful. Exports broaden the feedback loop by exposing Chinese OEMs and battery suppliers to more regulations, customer expectations, distribution models and service requirements. That can drive localisation, new partnerships and overseas production. It can also make the system more complicated. The global consequence is not a single outcome; it is a larger set of interactions between Chinese industrial depth and locally specific market conditions.
A usage tracker can show presence without becoming a league table
Company rankings are seductive because they seem to settle the story. A registered-battery-usage tracker is more useful when treated as one clean, time-bounded window into the system.
SNE Research reports 469.2 GWh of global EV battery usage for January through May 2026. In that tracker, seven Chinese makers in the global top ten represented 72.6% of the stated total; CATL represented 40.2% and BYD 14.4%. That January–May 2026 snapshot is a strong indicator that Chinese battery producers remain central to globally registered EV battery usage.
It is not a definitive corporate scorecard. The measure has a period, a coverage rule and a denominator. It does not establish a full-year result, a company’s earnings, a cell’s quality, a supplier’s capacity allocation or the best battery for a particular application. It does not convert the combined role of Chinese producers into a conclusion about every vehicle using their cells. The value of the tracker is that it gives the reader a current empirical signal without asking it to answer questions it was not designed to answer.
Used carefully, the result reinforces the main thesis. China’s battery system is globally consequential not only because of factories and materials, but because Chinese producers appear inside the installed-use picture of EVs across markets. That presence is one outcome of the demand, manufacturing and export loop. It does not remove the need to ask which cell, which pack, which factory, which warranty and which service path sit behind the product in front of you.
This distinction is especially useful when comparing vehicle narratives. A BYD–Tesla comparison can help a reader understand different approaches to product integration, pricing and market position. It cannot settle a specific battery or support decision through brand identity alone. Brand strategy tells part of the story; the configuration and the local operating environment finish it.
What the system changes for global readers
The feedback loop matters because it changes the default set of options. It makes Chinese OEMs, battery makers, materials and pack designs hard to treat as peripheral in a global EV, storage or supply-chain discussion. It can widen access to lower-cost vehicle architectures, large-scale LFP deployment, new battery configurations and suppliers that are learning at volume. It can also create dependencies, trade exposure, fast-moving revisions and service questions that are easy to miss if the reader looks only at a price sheet.
For a market reader, the first question is which layer is actually moving. Are electric-car sales rising? Is a local factory coming online? Is a vehicle being exported into inventory? Is a battery maker gaining registered usage? Is a new material plant an announced capacity or an operating source? The answer may be encouraging, worrying or neutral, but it will be more accurate once the denominator is named.
For a battery or storage reader, the first question is whether the battery claim is chemistry, cell, pack or system evidence. An industry page can explain why LFP is widely relevant or why Chinese cell and material production matters. It cannot identify the exact battery architecture in a storage cabinet, the firmware governing it, the certification applicable to its target market or the contract that supports it in service. For a broader stationary-storage context, China’s battery-storage boom is a useful next layer: it explains why stationary deployment and EV deployment should not be casually merged even when they share some technologies and suppliers.
For a sourcing reader, the first question is whether a country-level statistic is being used to hide a missing supplier file. “China makes most of the cells” is not an answer to “Can this supplier deliver this revision to this market under these terms?” The latter requires documents that identify the legal entity, factory, configuration, approval scope, capacity allocation, lead time, change control, warranty and service responsibility. The industry context tells you where to look. It does not sign the contract.
For an operator, the first question is how the system reaches the field. A vehicle’s battery and charging behaviour sit alongside diagnostics, spare parts, dealer capability, software updates and training. A pack’s underlying industrial lineage may explain why a component is available or why a design is competitive, but it cannot predict downtime, repair cost or service responsiveness. Those are product- and market-specific outcomes.
For a policy or risk reader, the first question is where the dependency actually lies. It may be in an active material, a cell, a pack, a vehicle model, a piece of manufacturing equipment, an export channel or a warranty relationship. Calling all of that “China risk” conceals the part that must be checked. The feedback-loop map is useful because it breaks a vague concern into observable layers.
Leave the industry map and open the product file
The final hand-off is the most important one. Once you understand the industry system, stop asking the industry page to decide the product.
Industrial scale cannot close a product file. Even the IEA’s capacity discussion warns that a battery plant can take more than five years to reach nominal output. If capacity cannot prove actual output, it certainly cannot prove the exact configuration, delivery allocation, test status, warranty or service result that matters in a transaction. The same is true of vehicle sales, battery deployment, material concentration, exports and registered usage. They are context. A product file is evidence.
Start by naming the object exactly. Record the supplier legal entity, brand, vehicle or battery model, trim or configuration, cell chemistry, physical cell format, pack revision, software or BMS version where relevant, production site if it matters, and target market. A family name is not enough. A model can use different packs in different markets, periods or trims. A company may change a supplier or cell revision without changing the broad marketing language.
Then separate technical evidence by layer. A cell datasheet speaks to a cell. A pack document should identify the enclosure, connections, thermal arrangement, sensing, BMS functions, charge/discharge limits and interfaces. A vehicle or storage-system document should show how the pack is integrated into a larger electrical, thermal and software system. If a claim spans layers—“fast charging,” “safe,” “long life,” “grid-forming,” “winter ready”—ask which document covers the whole claimed configuration and under what conditions.
The next table turns that boundary into a usable prompt.
| If a headline says… | Treat it as… | Open this next file |
|---|---|---|
| “China sold millions of EVs” | Domestic-market and programme context | The exact vehicle configuration, local warranty and service documentation |
| “China makes most battery cells” | Supply-chain concentration context | Factory, bill-of-materials and allocation evidence for the quoted pack |
| “This vehicle uses Chinese LFP” | A chemistry and integration clue | Cell/pack revision, thermal/BMS documentation and duty-cycle evidence |
| “Exports are surging” | A trade and channel signal | Local registrations, importer, parts, diagnostics and support route |
| “A leading maker has a large usage share” | A tracker snapshot | The exact supplier, cell and acceptance evidence for the product being considered |
| “A plant has huge capacity” | A possible future supply indicator | Actual output, qualification, allocation, delivery and change-control records |
For a commercial review, make the service and change-control path visible. Who is the warranty counterparty? What components are covered? Which exclusions or operating conditions matter? Who has diagnostic access? Where are replacement parts held? What happens if a cell, pack component, BMS, software version or production site changes? These questions are not administrative extras. They determine whether the technology remains usable after shipment.
For an origin, regulatory or procurement review, request the records appropriate to the decision. A country-level manufacturing share is not a certificate of origin. A public standard reference is not configuration-specific conformance. An export statistic is not an import clearance. The necessary documents depend on the target market, contract, vehicle class, installation, financing or insurance context. This guide does not make those determinations; it identifies why they cannot be made from an industry headline alone.
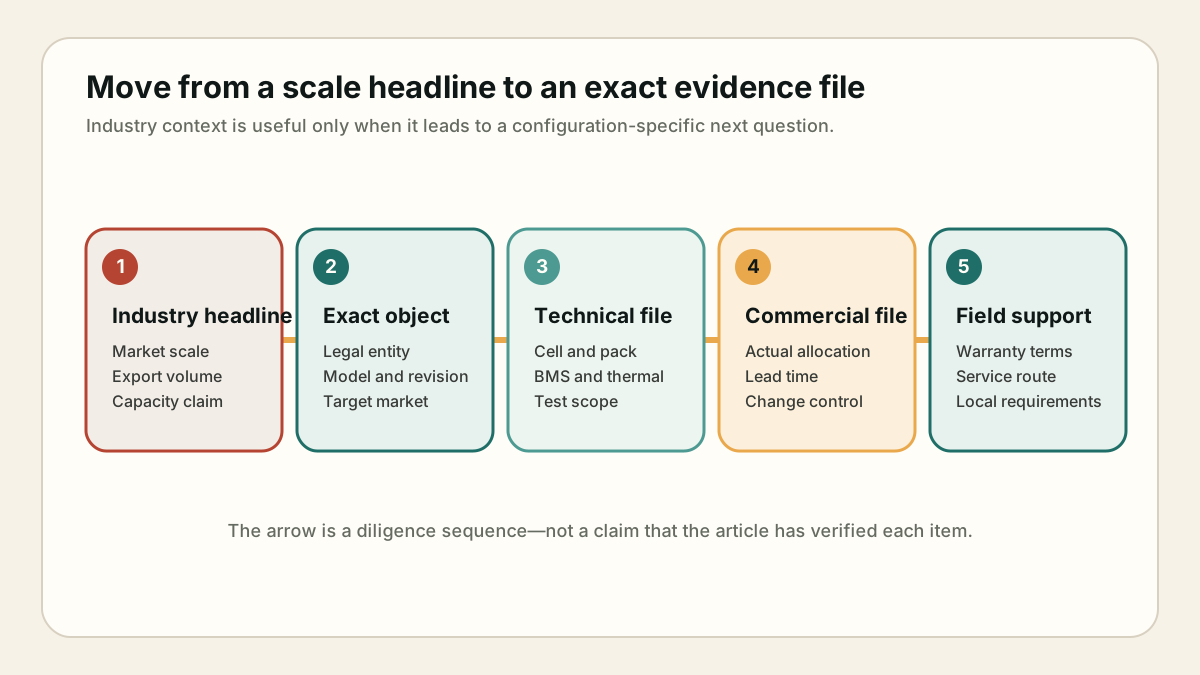 Use the sequence to turn an industry statistic into the next configuration-specific evidence request.
Frequently asked questions
Is China’s EV battery industry dominated by CATL and BYD?
They are highly visible in current battery-usage tracking: SNE Research’s January–May 2026 tracker lists CATL at 40.2% and BYD at 14.4% of its stated global usage measure. That is useful context for the market structure, but it is not a universal quality ranking or a reason to assume a particular vehicle uses either company’s cells. The exact battery and pack configuration still need to be identified.
Why are China’s electric-car sales and NEV sales not the same number?
They come from different records and use different category definitions. The IEA’s electric-car market estimate and the MIIT’s official Chinese NEV production-and-sales record are both valuable when they retain their own labels, periods and denominators. Treating them as interchangeable can distort the domestic-market picture.
Do Chinese battery manufacturing shares tell me where a battery was made?
No. They describe industry concentration at the global level. A particular cell or pack may involve different material, cell, module, pack and vehicle-assembly locations, and the relevant answer depends on the evidence for that specific configuration and transaction.
Does rapid Chinese EV export growth prove strong foreign demand?
No. It proves an export flow, but the IEA’s 2025 comparison between reported exports and estimated overseas sales indicates that inventories can matter. To understand a specific foreign market, look at registrations, channels, local production, pricing, service support and the importer’s position.
Method and limitations
This is a desk-research guide current through 26 August 2026. It uses the IEA for global EV, battery, manufacturing and trade context; the Chinese Ministry of Industry and Information Technology for the official 2025 NEV production-and-sales record; and SNE Research for a January–May 2026 registered-battery-usage snapshot. The figures use different definitions and periods, so the article deliberately keeps them separate.
China Made & Tech did not test a vehicle, battery or storage system; audit a factory; review a supplier’s private allocation; inspect a shipment; or conduct a procurement, legal, customs, safety or compliance determination. Before a purchase, sourcing, fleet, engineering, market-entry or policy decision, recheck current sales, production, deployment, export, trade, configuration, test, warranty and service records for the exact product and market in scope.
Related entries
For vehicle integration, see the BYD–Tesla comparison. For batteries beyond cars, continue to China’s battery-storage boom. For the wider supplier-environment question, use the China industrial-clusters guide.