
By China Made & Tech Team
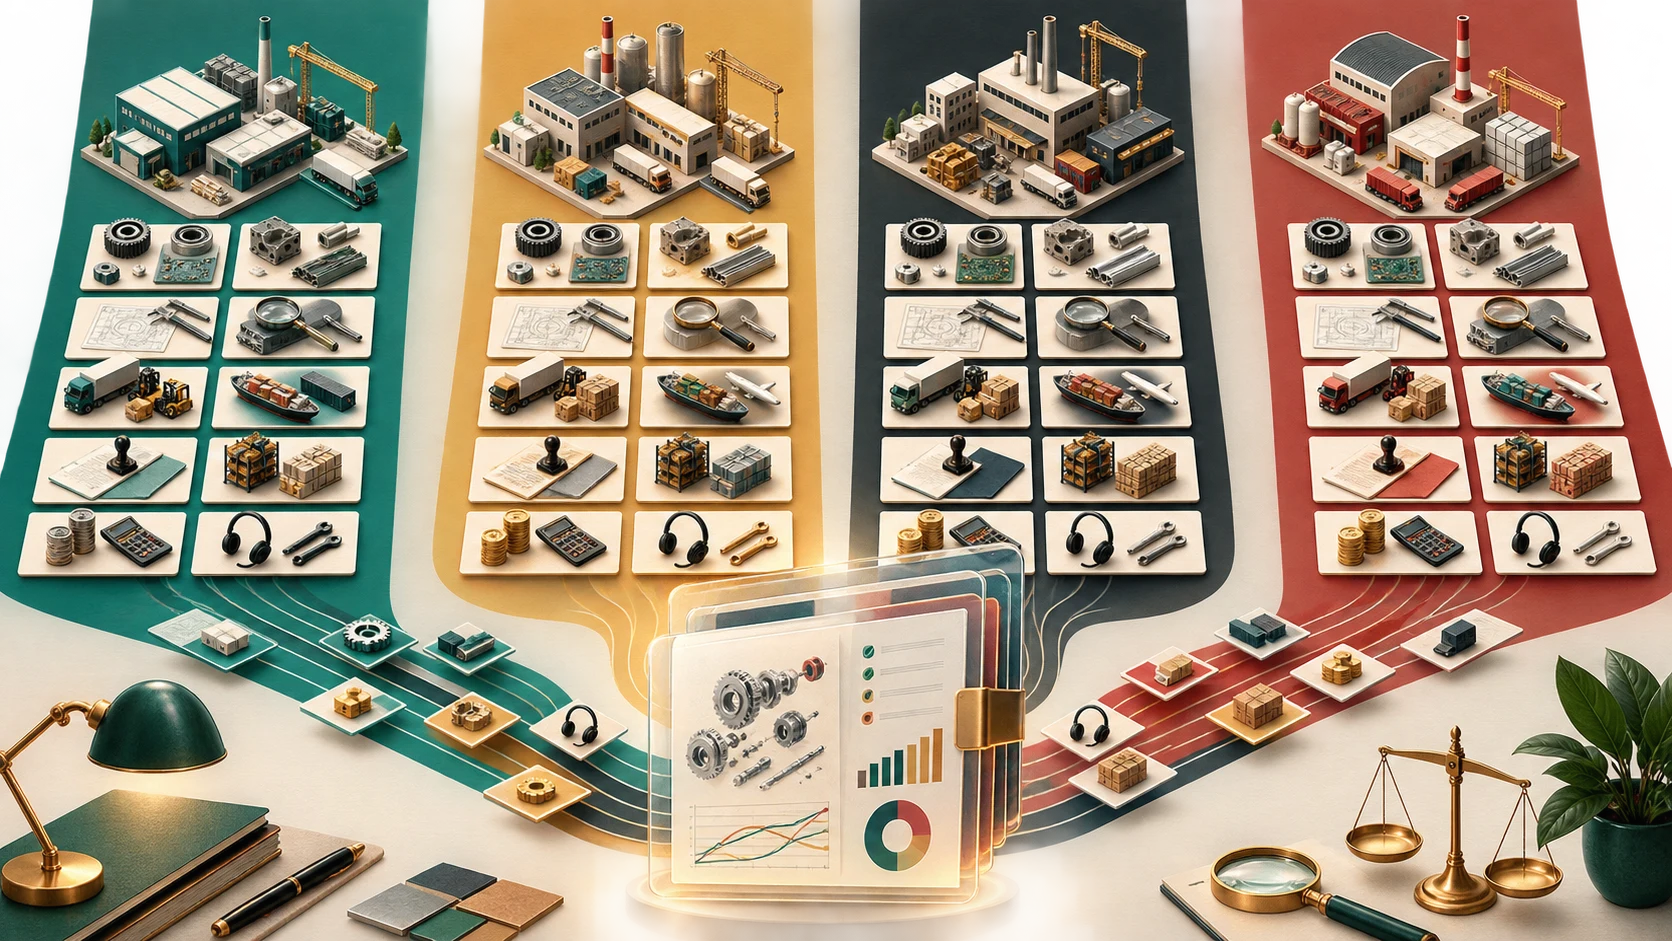
AI-generated editorial illustration. It depicts no real factory, country, product, company, shipment, document, or performance ranking.
The question sounds clean: where should we manufacture this product—China, Vietnam, India, or Mexico? The first spreadsheet usually makes it look cleaner still. Four hourly wage cells, four factory quotes, four shipping estimates, and a highlighted “winner.”
That spreadsheet is useful only as a first screen. It is not a manufacturing-cost comparison.
The cost that matters is not the number on a supplier's quotation. It is the cost of selling a particular revision of a product, with a particular bill of materials, to a particular market, at a required service level, while surviving the failures that the plan says are possible. A lower ex-works quote can be overtaken by imported components, an engineering-change loop, a rejected lot, a missed launch, additional inventory, an origin problem, or a warranty burden that was never assigned.
The World Bank's current Logistics Performance Indicators are a useful warning against a one-number winner table. LPI 2.0 covers 2023 and 2024 data, uses 21 country-level indicators based on shipment-level tracking data, and does not publish one official overall country ranking. It measures logistics conditions such as connectivity, speed, and reliability; it does not quote the freight price or total manufacturing cost for your product. The World Bank's LPI 2.0 description is therefore an input to a sourcing file, not a result.
This guide gives you that file. It compares China, Vietnam, India, and Mexico as candidate lanes. It does not declare a universal winner. The buyer who needs a winner should first make the comparison unit real.
Start with the comparison unit, not the country
Write the comparison unit in one sentence before requesting a quote:
> One specified product revision, at a stated annual volume and ramp, with a named bill of materials, delivered under named commercial terms to a named destination market, with a stated quality, service, inventory, and payment requirement.
Without that sentence, “China versus Vietnam” is not a decision. A basic power supply, a connected garden device, a dining chair, and a stamped automotive component can all be made in the same country, but they consume very different supplier networks, engineering resources, transport modes, working capital, inspection methods, certification files, and recovery plans.
The location comparison has four layers:
- Product system. What is physically in the product? Which components are bespoke, long-lead, imported, safety-critical, fragile, bulky, or subject to repeated revision?
- Production system. What process capabilities, tooling, fixtures, test stations, operator training, packaging controls, and sub-suppliers are needed to turn that design into a repeatable unit?
- Route system. How does the product move from factory to customer or distribution centre? What must it clear, qualify for, be insured for, and be replenished through?
- Commercial system. Who funds materials, tooling, deposits, safety stock, rework, replacements, and delayed receipts? Which party owns each failure before it reaches the customer?
Country belongs inside every layer, but it cannot substitute for any layer. A useful comparison asks, “Which lane can supply this product-route system at the lowest risk-adjusted cost?” It does not ask, “Which country is cheap?”
That distinction connects this article to the broader work of sourcing in China. Diversification is not a second pin on a map. It is a second operational system that must be costed, tested, and governed.
The quote is only one line in the cost file
Use one cost file for every candidate. Do not let one country quote ex-works, another quote delivered, and a third quote only assembly labour. Normalize the assumptions first, then compare the outputs.
| Cost file line | What to collect | The mistake it prevents |
|---|---|---|
| Product and BOM | Revision-controlled BOM, alternative parts, origin of key inputs, yield assumptions | Comparing unlike products or quietly substituting materials |
| Factory conversion | Labour content, machine time, tooling, fixtures, test, packaging, overhead assumptions | Treating a labour rate as the unit cost |
| Engineering | NRE, samples, DFM work, change-order process, retest, document control | Assuming development is free because it is absent from the quote |
| Quality loss | Incoming defects, in-process yield, inspection, rework, scrap, returns, containment | Pricing only units shipped, not units that fail |
| Logistics | Pickup, export handling, mode, consolidation, transit variability, insurance, destination handling | Using one spot freight rate as a stable delivery cost |
| Trade and compliance | Classification, origin path, customs value, duties, testing, labels, records | Confusing factory location with import treatment |
| Inventory and cash | Deposit, material commitment, lead time, safety stock, payment terms, currency exposure | Ignoring cash tied up while goods are not sellable |
| Service and recovery | Spare parts, repair, replacements, reverse logistics, escalation owner | Leaving the cost of failure outside the sourcing decision |
> Decision cost per sellable unit = product and conversion cost + engineering allocation + quality-loss allowance + route cost + trade/compliance cost + inventory/cash cost + expected service/recovery cost.
Then add a downside view: what happens if volume is 30% below plan, a key component slips, a revision occurs after tooling, a lot requires containment, or a shipment arrives late? The lowest expected cost and the lowest decision cost are often different.
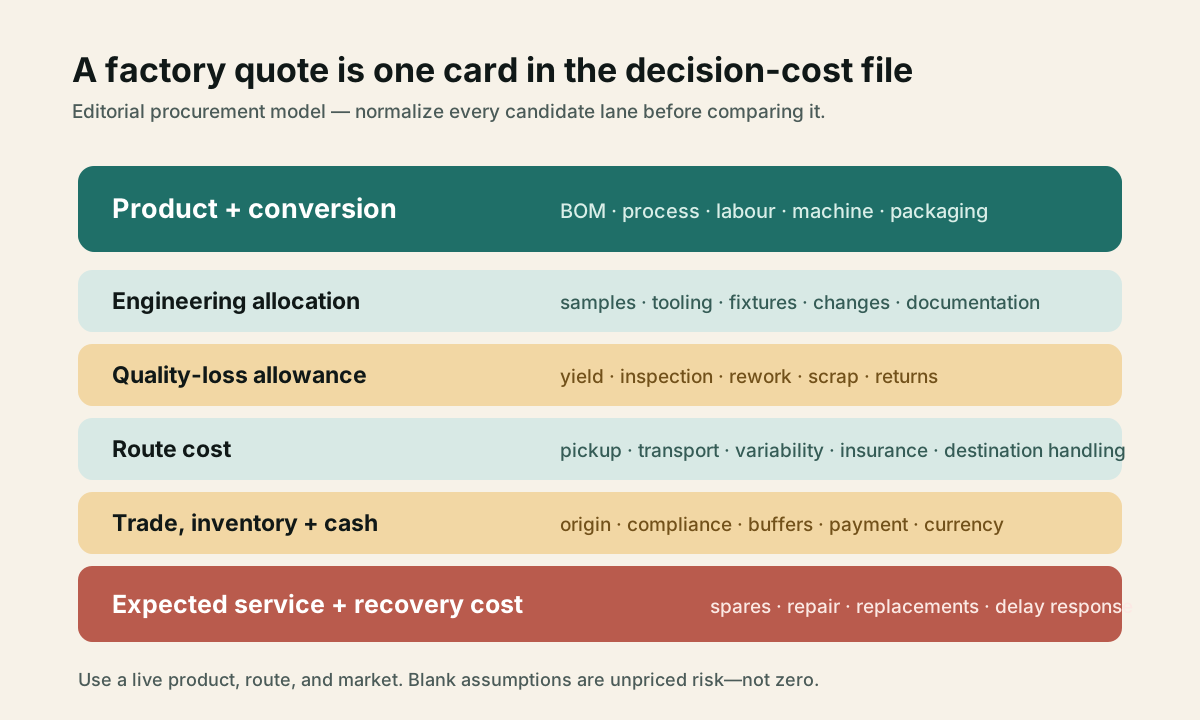
Editorial cost stack: normalize all candidate lanes against the same product, route, and market before comparing them.
Price, customs value, and the hidden commercial terms
For an import into the United States, the quoted product price is not automatically the end of the customs-value discussion. U.S. Customs and Border Protection says the commercial invoice should state the price the U.S. buyer paid for the goods and explains that specified additions can include selling commissions, assists, royalties, production costs, and packing when applicable. It also notes that its general answer is not a transaction-specific reasonable-care determination. CBP's commercial-invoice guidance is a sharp reminder that tooling, buyer-supplied components, engineering, and commercial conditions must be captured before a team calls an ex-works number “landed cost.”
That is not an instruction to self-calculate a customs entry. It is a request to surface the facts early. If the buyer supplies a mould, design work, components, or another production input, record who supplies it, how its cost is allocated, how many units the allocation covers, and what happens when the revision changes. Keep the contract, purchase order, invoice, BOM, and finance model aligned. A location comparison becomes unreliable when those documents describe different commercial realities.
The same discipline applies outside the United States. Ask the relevant customs, tax, and trade specialists to review the actual destination and transaction. The decision file should preserve the input and the question; it should not pretend that a public guide has resolved it.
Logistics is a variability problem as well as a rate problem
Freight is often entered as a dollar-per-container estimate and then ignored. That misses the economic effect of reliability. A route that needs more safety stock, larger buffers, expedited recovery, or more frequent split shipments can cost more even when its headline freight rate looks attractive.
Treat every lane as a small operating model:
* What is the normal door-to-door lead time by mode? * What is the credible high-percentile lead time, not only the average? * Which node fails first: inland pickup, port, transshipment, customs clearance, final delivery, or warehouse appointment? * How much inventory is needed to protect the promised service level? * What is the recovery option if a container, approval, or component misses its date?
The World Bank explicitly frames LPI 2.0 around supply-chain connectivity, speed, and reliability. Use that framing to request route-specific data from your forwarder and logistics team. Do not use a country indicator to claim that a factory, port pair, or shipment is reliably cheaper.
Product category changes the economics
Four country names cannot do the analytical work that product architecture must do. Build category-specific hypotheses before you ask candidate suppliers to validate them.
Electronics: components, iteration, and test discipline
For electronics, the apparent assembly-labour advantage may be small beside component availability, engineering change speed, firmware and test coordination, yield, and the ability to trace a failure across suppliers. A low assembly quote is not valuable if the required controller, battery, connector, enclosure, charger, test fixture, or certification evidence introduces a longer or less controllable path.
Ask each lane to show the same evidence:
* a revision-controlled BOM with dual-source status and country-of-origin information for material inputs; * a DFM and DFT plan that identifies test coverage and the owner of each fixture; * a pilot build path, yield definition, failure-analysis loop, and change-control owner; * the software, account, security, and field-update responsibilities for a connected product; and * a service file that says who holds spare parts, repairs units, and decides when a defect becomes a field action.
China may be a serious candidate where the exact product benefits from dense component and manufacturing networks; that is a question to test at the specific product level, not a privilege that follows from a country name. The same is true for Vietnam, India, and Mexico: map component import exposure, engineering handoffs, and test recovery before treating a local assembly location as an all-in electronics system.
Textiles: material route, quality definition, and replenishment
Textiles look labour-sensitive because cutting and sewing are visible. But the delivered economics can turn on fabric availability, colour and shade management, trim sourcing, washing and finishing, minimum order quantities, sample cycles, inspection standards, seasonality, and the cost of a late replenishment.
The comparison file should identify the fabric and trim origin, test requirements, approved sample process, defect definition, carton plan, mode split, and reorder policy. A buyer who compares only cut-and-sew cost can miss the commercial effect of a material substitution, failed colour approval, or inventory tied up before a seasonal window.
For a textile program, a country lane earns credibility when it can demonstrate the full material-to-delivery path for the chosen product and market. “Lower labour” is only one hypothesis in that demonstration.
Furniture: cube, damage, packaging, and installation
Furniture often moves the decision toward physical geography because bulky products consume cube, packaging, warehouse space, and last-mile handling. Yet a nearby factory is not automatically lower cost if damage rates, packaging redesigns, material variability, installation failures, or replacement-part handling are ignored.
Build the model around sellable delivered units. Include wood, metal, upholstery, finishes, hardware, packaging, container utilization, damage claims, assembly instructions, spare parts, and returns. Request drop-test or packaging evidence where it is relevant to the product, but do not infer a quality result from a country label.
This is where a route-specific comparison is more useful than a generic location story. Mexico may deserve a close look for a North American furniture route; China, Vietnam, and India may all deserve one too. The selection turns on the actual product cube, material network, required service area, and recovery economics—not on a slogan about distance.
Automotive and industrial components: approval, origin, and change control
Automotive and industrial supply can make low labour nearly irrelevant when approval, traceability, process capability, tooling, validation, inventory, and change notification carry the real downside. The target is not the cheapest sample. It is a controlled production process that can satisfy a buyer's technical, commercial, and regulatory requirements over time.
Use the location comparison to expose dependencies: Which inputs are sourced locally? Which process is special? Who owns the tool? What traceability follows a part through sub-tier suppliers? What is the notification rule for a material, process, or site change? How many weeks of validated inventory protect the customer? Who bears the cost when a change reaches the field?
Mexico also requires special discipline for North American routes. The WTO explains that rules of origin determine a product's economic nationality and can affect preferences, quotas, and trade remedies. The U.S. Trade Representative's USMCA overview states that the agreement entered into force on July 1, 2020 and highlights rules of origin, including product-specific rules. A product assembled in Mexico is therefore not, by location alone, proof of any particular treatment. Keep the exact inputs, transformation, classification, document trail, and qualified advice inside the live file.
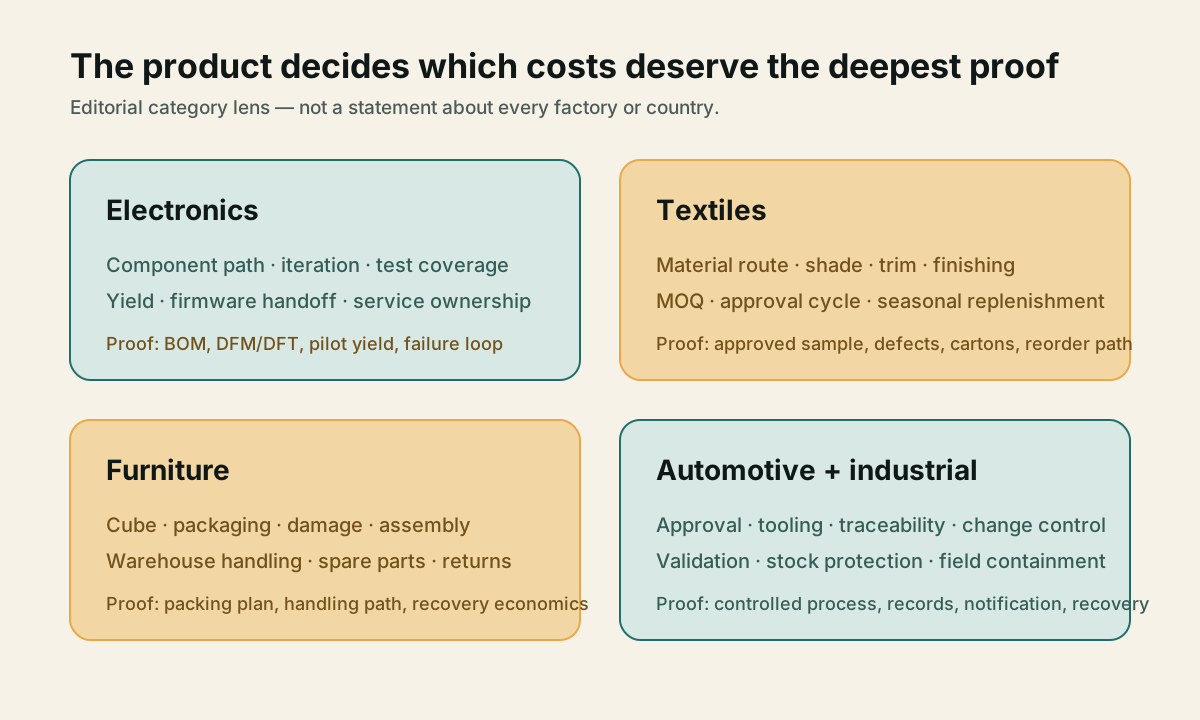
Editorial category lens: the product changes which cost and proof questions deserve the deepest review.
Compare the four lanes with the same questions
The right country matrix contains evidence requests, not a column called “winner.” The table below gives the first questions for China, Vietnam, India, and Mexico. The cells deliberately describe what to validate rather than what is true of every supplier in that country.
| Candidate lane | Ask about the product system | Ask about the production system | Ask about the route and commercial system |
|---|---|---|---|
| China | Which component, tooling, and process clusters support this exact BOM? Which key inputs are single-source or imported? | Can the supplier own DFM, test, change control, and sub-supplier coordination at the required ramp? | What are the route options, inventory needs, currency and payment exposure, and service handoffs for the named market? |
| Vietnam | Which materials and components are available through the proposed production path, and which remain imported? | How are engineering, testing, supplier quality, and expansion capacity controlled for this product? | What buffers, consolidation points, documentation, and recovery routes are needed to meet the market promise? |
| India | Which local and imported inputs drive lead time and cost for the configured BOM? | Who controls tooling, process qualification, test, and supplier development through the ramp? | How do inland moves, export route, documentation, inventory, and payment timing affect the delivered plan? |
| Mexico | Which inputs are regional, imported, or subject to a specific origin analysis? | Can the proposed site control validation, change notification, traceability, and service parts? | Which destination routes, USMCA questions, customs records, inventory buffers, and cross-border recovery steps matter? |
For China, begin with an industrial-system map rather than a factory web search. China's industrial clusters and county-level clusters can help identify where a product's component and process questions should be investigated; they do not certify a supplier. For any country, pair the system map with the practical supplier and quality work in how to find a factory and quality control. The method transfers even when the geography changes.
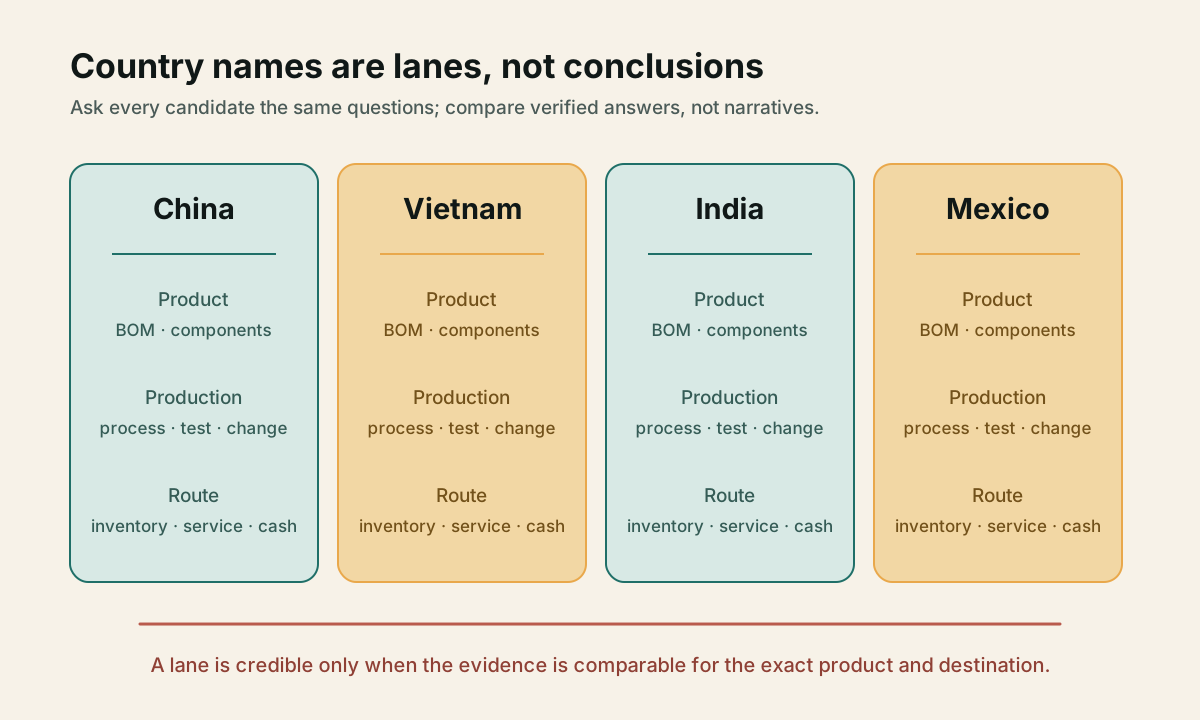
Editorial lane map: country labels organize comparable evidence requests; they do not deliver a universal winner.
Build a landed-cost file that operations can actually use
The most useful output is not a polished executive deck. It is a shared file with assumptions, owners, dates, sources, and a record of what would change the decision.
Set up five tabs or equivalent sections.
1. Product baseline
Freeze the candidate revision. List target volume, forecast range, variants, BOM, packaging, drawings, software version where relevant, critical quality characteristics, required certifications, destination, Incoterm, and target customer promise. If two candidate lanes require different designs, tool sets, materials, or test methods, make those differences explicit instead of pretending they quote the same thing.
2. Common cost stack
Give every lane identical rows, units, and allocation rules. Separate one-time costs from recurring costs. Separate fixed minimum-order exposure from unit costs. Record the currency, quoted validity, commercial terms, lead time, and exact exclusions beside each number.
Avoid a common spreadsheet failure: putting a positive value in the cheapest factory-cost cell and leaving the unquoted rows blank. Blank is not zero. Blank means “unpriced risk,” and it should be visible as such.
3. Evidence and owners
Every material input needs an owner and a source: engineering owns BOM and test assumptions; sourcing owns quotations, supplier terms, and capacity evidence; quality owns inspection and failure definitions; logistics owns route and buffer assumptions; finance owns allocation, currency, and cash; trade or legal specialists own the transaction-specific compliance questions.
This is especially important when a company combines production, design, branding, and service roles. OEM, ODM, and own-brand labels tell you where to start asking; they do not allocate the cost or liability in your exact product file.
4. Downside cases
For each lane, model at least four conditions:
* forecast below plan and its effect on minimums, committed material, and amortization; * an engineering change after initial samples or tooling; * a quality containment event before or after shipment; and * a transport or customs delay that requires a recovery decision.
You do not need to predict every failure. You need to find which failure changes the choice. If a lane remains viable only when every assumption is perfect, its cheap quote should carry a risk premium in the decision conversation.
5. Decision gate
Do not release a location decision after a quotation comparison. Use gates:
- Screen. Is the product and market defined enough to request comparable proposals?
- Prove the system. Can each candidate show its BOM, process, capacity, quality, route, and commercial assumptions?
- Cost the downside. Have inventory, change, defect, and delay cases been assigned a cost and owner?
- Validate the trade path. Are origin, classification, valuation, documentation, and market requirements being reviewed for the actual transaction?
- Commit in stages. Start with a pilot and measurable acceptance criteria before tooling, volumes, or public customer promises become difficult to reverse.
The fifth gate is governance, not hesitation. A staged release makes it possible to learn about yield, communication, route reliability, and recovery while the cost of changing course is still manageable.
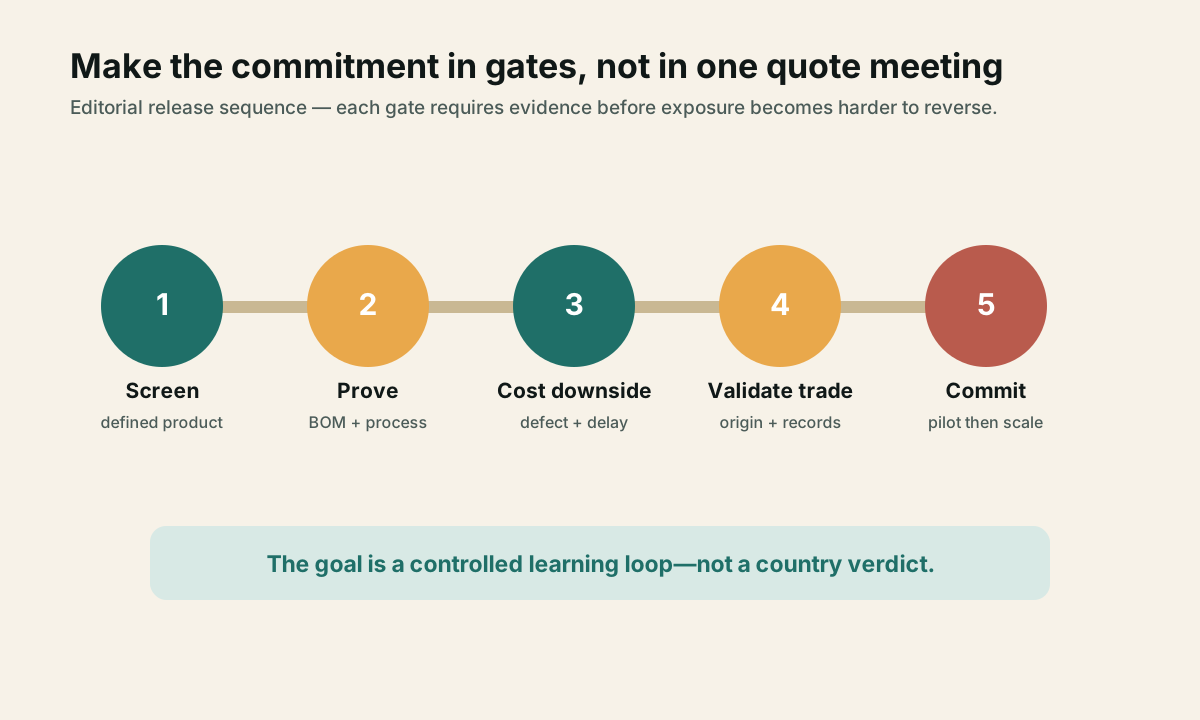
Editorial release sequence: raise proof before a financial, operational, or customer commitment becomes hard to reverse.
Price the transition, not only the steady state
The most expensive omission in a four-country comparison is often the transition cost. A second source or a new country is not a free copy of the first production line. It may require a different supplier base, drawings translated into different working conventions, new test fixtures, duplicate qualification, engineering travel, pilot lots, inventory overlap, new supplier-quality routines, added management time, and a second recovery path. Those costs can be rational; they simply belong in the investment case.
Separate the answer into two time horizons.
| Horizon | The question | Costs and proof to capture |
|---|---|---|
| Transition | What must be spent or risked to make this lane capable of a controlled launch? | New tooling, NRE, sample rounds, qualification, test fixtures, documentation, pilot yield, duplicate inventory, project staffing, and approval gates |
| Steady state | What does a sellable unit cost after the lane has stabilized at the specified volume? | Material, conversion, quality loss, logistics, trade/compliance, inventory, service, payment, and recovery assumptions |
The same rule applies to dual sourcing. A second supplier can lower disruption exposure while increasing unit cost, inventory, management load, qualification work, and demand fragmentation. That is not evidence that dual sourcing is wrong. It means resilience is a purchased capability, not a zero-cost side benefit. Give it a line in the file and let the business decide how much protection it wants.
Test the assumptions that can reverse the answer
Avoid adding hundreds of weak assumptions to a spreadsheet. Find the small number that can change the winner. For a compact electronics product, that may be a key component's lead time, pilot yield, air-freight recovery, or engineering-change frequency. For furniture, it may be container utilization, damage rate, warehouse handling, or the cost of replacement parts. For automotive parts, it may be qualification timing, a traceability failure, origin treatment, or premium freight during a customer schedule change.
For every possible reversal, document four things:
- The assumption. State the input and the source. “Transit time: 32 days door to door” is better than “fast shipping.”
- The threshold. State the value at which Lane A and Lane B become economically equal. This makes management discussion concrete: “If air recovery is required twice in a quarter, the lower unit-price lane loses its advantage.”
- The owner. Name who can validate or reduce the uncertainty: supplier quality, engineering, freight, trade, finance, or commercial leadership.
- The test. Name the next evidence event: a pilot yield report, a route trial, a freight tender, a sample approval, an origin review, a capacity audit, or a customer-service simulation.
This turns sensitivity analysis into a work plan. It also keeps teams from debating countries through anecdotes. The decision is no longer “Which nation is better?” It becomes “Which unproven input is large enough to change the release, and how quickly can we test it?”
Use country lanes to expose operating choices
The four-country matrix is most valuable when it reveals the operating choice hidden inside the location choice. A China plan might depend on a tightly coordinated component and process ecosystem. A Vietnam plan might depend on material or engineering imports that need a different buffer policy. An India plan might depend on a specific mix of local and imported inputs plus a particular project ramp. A Mexico plan might depend on a North American route, a regional content and origin file, and cross-border service design.
None of these statements is a judgment about every factory or product. They are prompts to name the dependency. Once the dependency is named, it can be quoted, tested, scheduled, insured, contracted, or rejected. Until then, a country name merely hides it.
When teams become stuck, make three versions of the recommendation rather than forcing a false consensus:
* Cost-led. The lane with the lowest expected steady-state cost under clearly stated volume and route assumptions. * Speed-led. The lane that can meet the product-launch date with the fewest unproven engineering, qualification, and route steps. * Resilience-led. The lane or two-lane design that best protects the service promise against the specified failure scenarios.
Those recommendations may all point to the same answer. When they do not, the difference is decision-relevant information. It tells leadership whether it is buying cost, time, or resilience—and what the selected benefit will cost.
When a country comparison is ready for a decision
The file is ready when the choice can be stated plainly:
> For this revision, volume, market, and service promise, Lane A has a higher or lower expected decision cost than Lane B because of named assumptions, with named evidence and owners. These are the two events most likely to reverse the choice, and this is how we will test them.
That is a better decision than “Country X has lower wages” or “Country Y is closer.” It is also easier to update. If a component changes, a trade rule changes, a product revision slips, or the destination expands, reopen the affected rows rather than rebuilding a country narrative from scratch.
China, Vietnam, India, and Mexico can all be credible candidate lanes. Their credibility is not a property of the label. It is earned by the way a specific product, supplier system, route, and commercial plan fit together.
Method and limitations
This is desk research and an editorial decision framework, not firsthand sourcing, factory, freight, customs, quality, or product-testing evidence. It uses public World Bank, WTO, U.S. Customs and Border Protection, and USTR records to define logistics, customs-value, origin, and agreement boundaries. Those records do not calculate a reader's freight, tax, duty, customs value, origin, quality outcome, factory capability, or total manufacturing cost.
Before making a live commitment, recheck the exact BOM and revision, material and origin path, HS classification, destination rules, tariff and preference eligibility, transport mode, insurance, commercial terms, capacity, quality evidence, inventory policy, payment terms, and service obligations with the appropriate transaction-specific specialists.